What’s new in CloudBees Build Acceleration 12.0?

Just in time for the new year, this month we released CloudBees Build Acceleration 12.0, the 40th feature release of the product previously known as CloudBees Accelerator and before that ElectricAccelerator. This is possibly the most significant update for most end users since the 8.0 release in 2015, thanks to a massive overhaul and expansion of the Build Details page in the Cluster Manager that puts metrics, visualization and even recommendations just a click away in your browser. We also improved jobcache, by adding context-sensitive hashing for C/C++ source files — no more cache misses when you change comments! — as well as content-sensitive hashing for Unix archives, and support for caching Kotlin compilation. Finally, we added an enhancement to our GNU make emulation to automatically create output directories: no more need for messy order-only prereqs or sentinel files or mkdir -p $(dirname $@) all over your makefiles. Keep reading for screenshots and more details.

Build Details

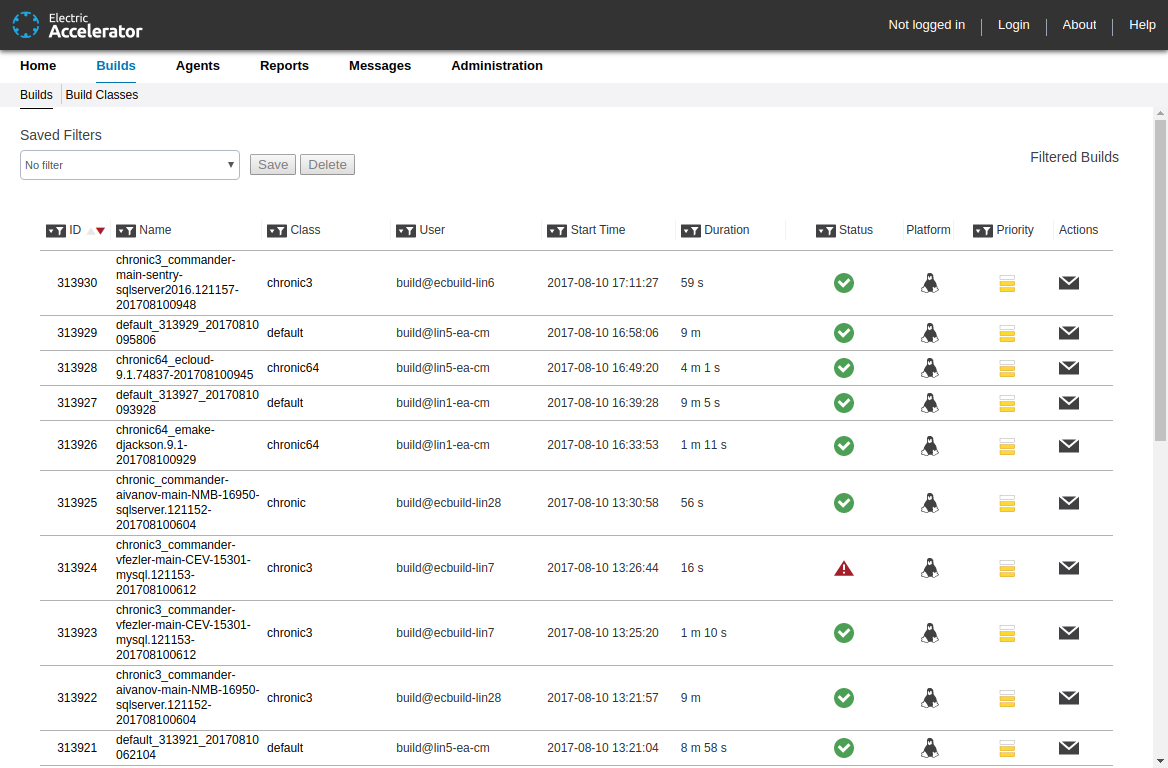
The improvements I’m most excited about in Build Acceleration 12.0 are the sweeping updates to the Build Details page in the Cluster Manager. These are designed to give you access to build visualization and performance analysis, right from the comfort of the browser. Much of this functionality has been available for a long time as part of Insight, a desktop application for build visualization and analysis, but we found that few users took advantage of that functionality. We hope that by automatically collecting the data and providing it via the Cluster Manager web interface, more users will be able to leverage that analysis not only to see the benefit they derive from using Build Acceleration, but to better monitor and improve performance. The update consists of a redesigned UI framework for the Build Details page, as well as several new or enhanced sub-tabs:

  • The Settings tab shows both the user-specified options used in the build, as well as any other properties determined by emake itself, like the OS version and others.
  • The Environment tab shows the environment variables in effect when emake was invoked.
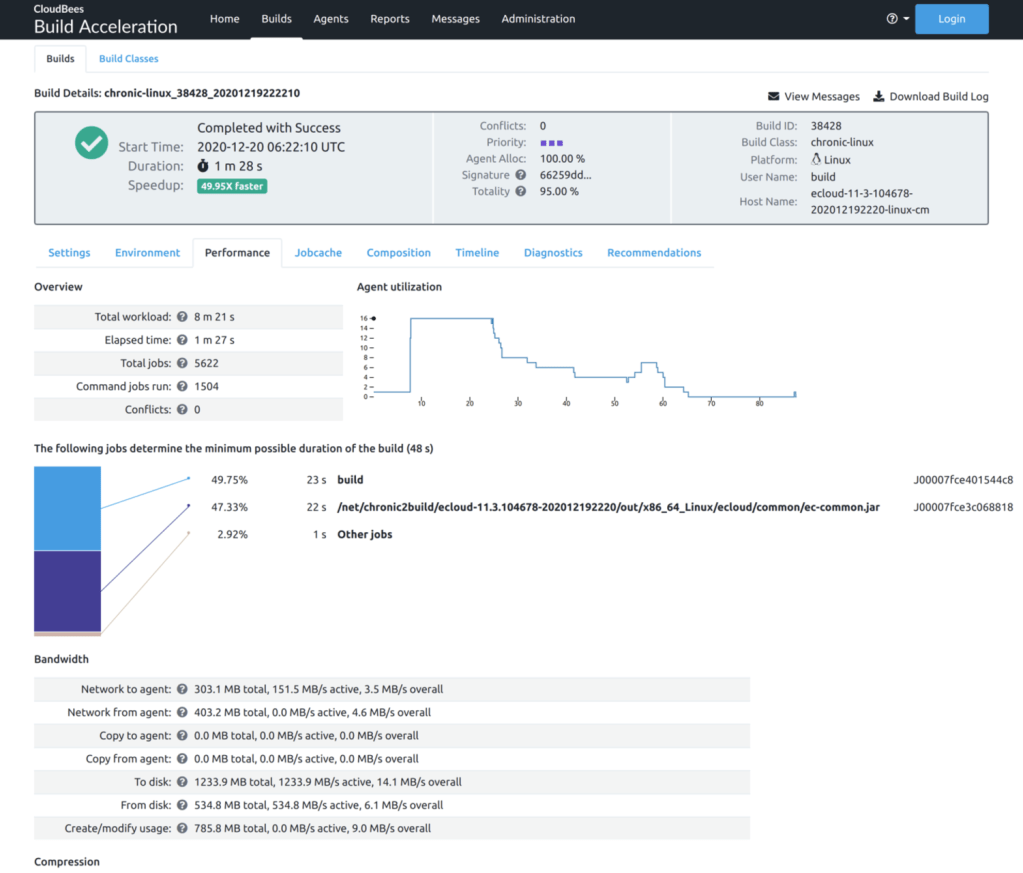
  • The Performance tab shows dozens of individual performance metrics, such as network and disk bandwidth and compression performance, as well as the number of agents in use over the duration of the build and the critical path through the build, or the serialized set of jobs that determines the minimum possible duration of the build.
  • The Jobcache tab shows metrics relating to the use of jobcache in the build, including the overall cache hit rate, the estimated time saved due to caching, and the specific types of jobcache used. You can also find the portion of the total build workload that was cached.
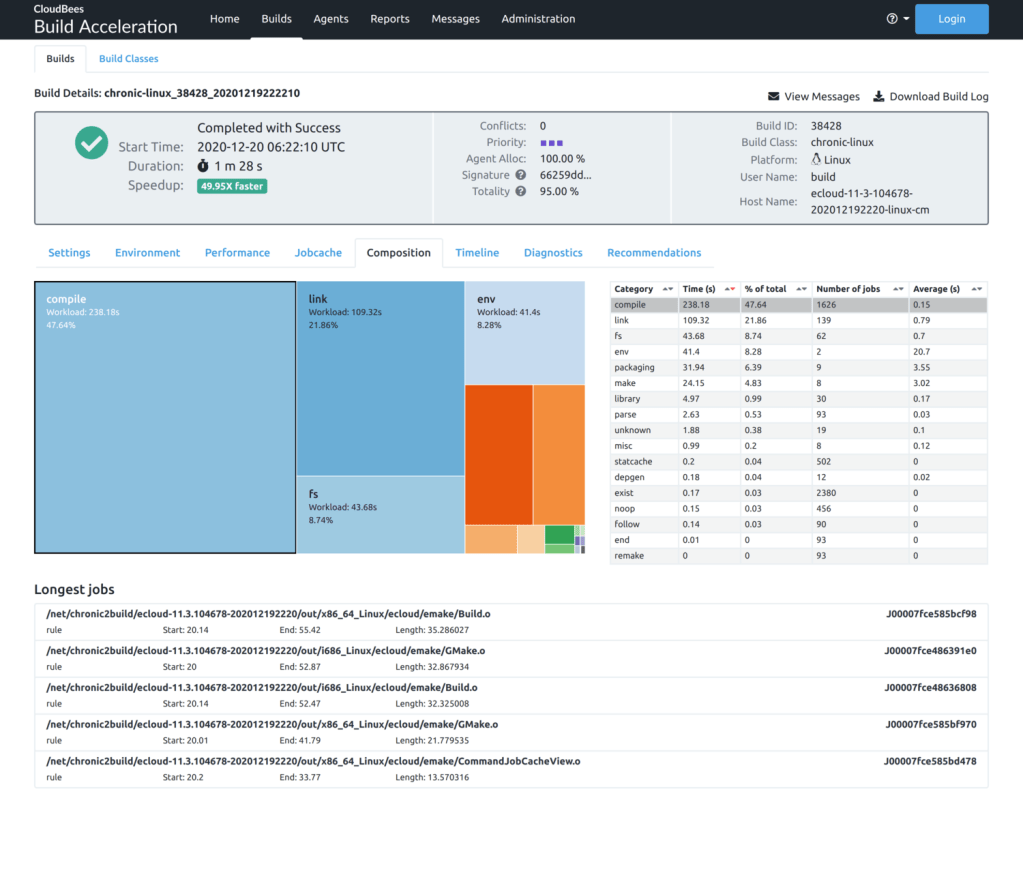
  • The Composition tab shows a breakdown of the work performed during the build according to the semantic classification of that work, such as compilation, linking, or packaging. Clicking on any of the categories shows the longest jobs in the build belonging to that category.
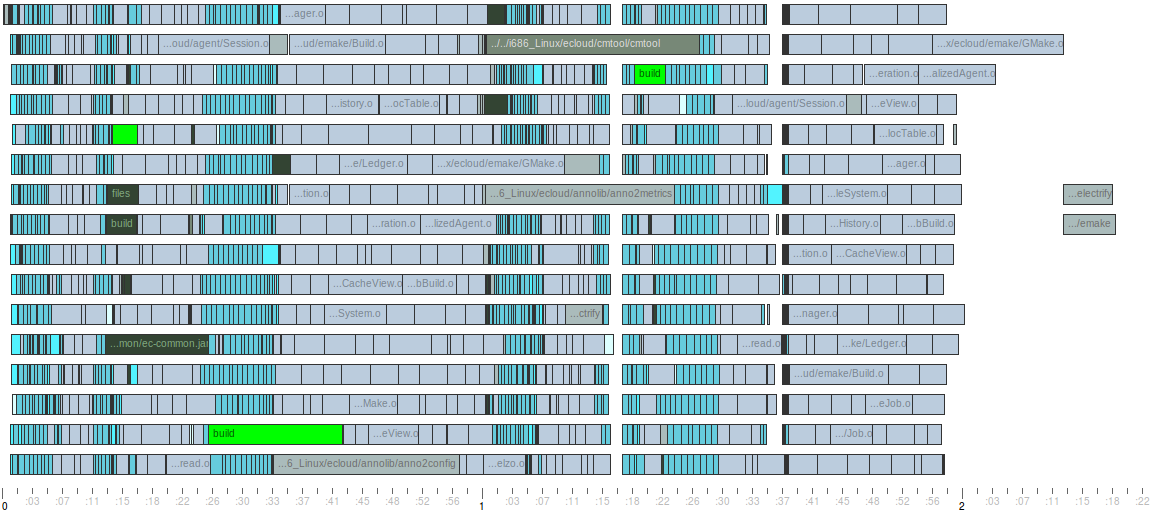
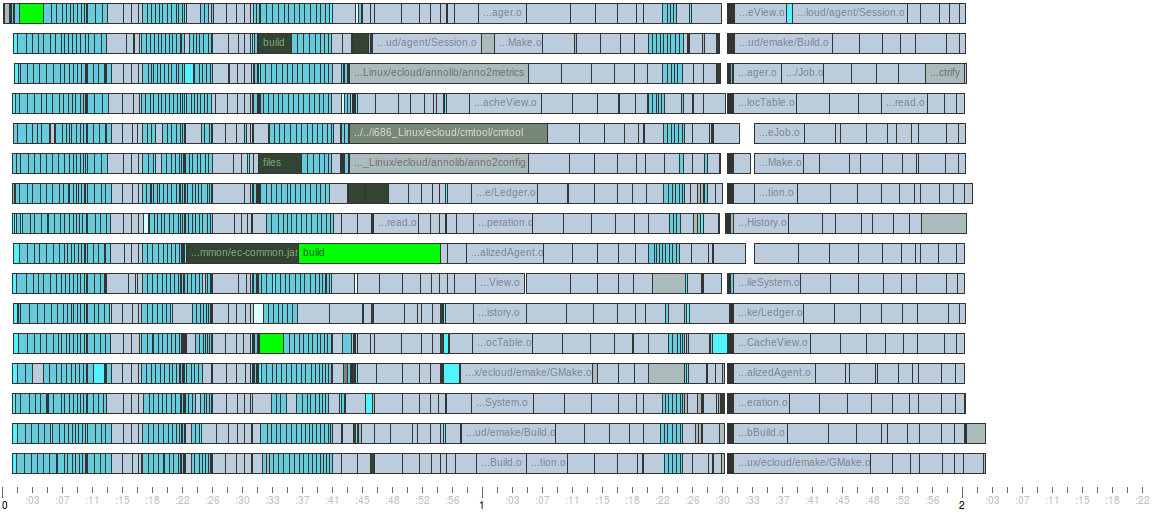
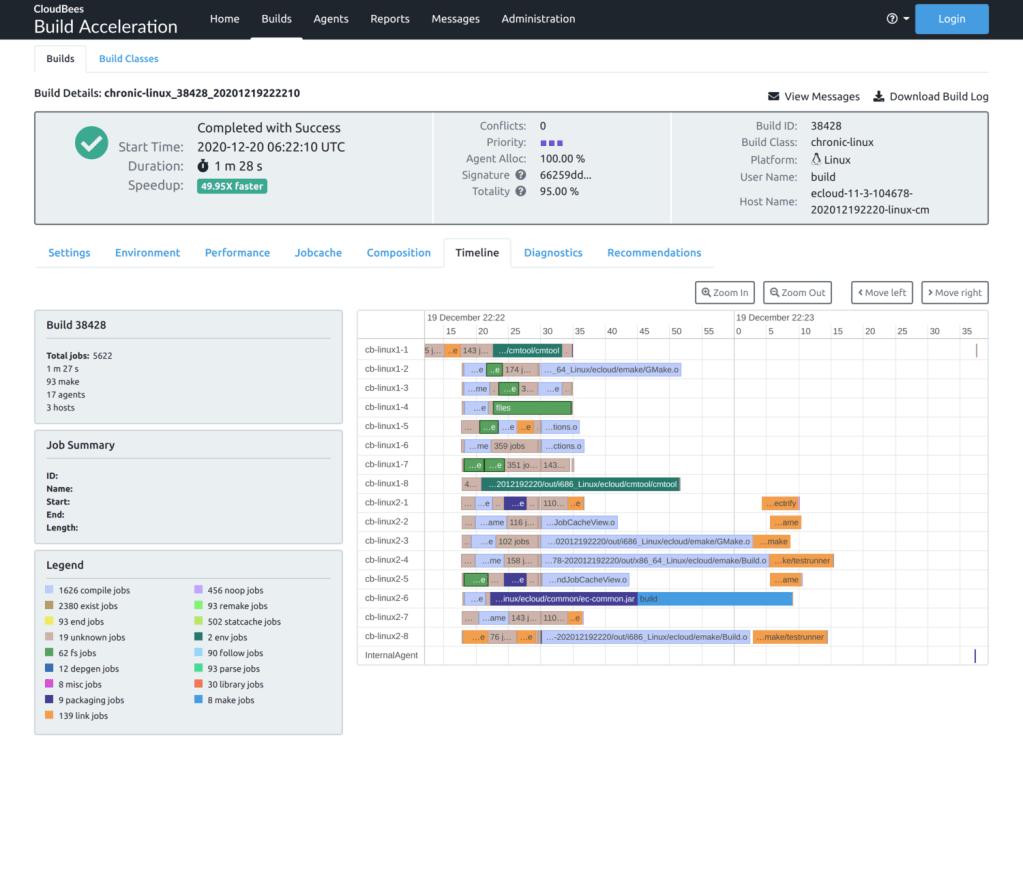
  • The Timeline tab shows a visualization of the build’s execution. For efficiency reasons (both in terms of rendering and backend storage) detailed information is only available for non-trivial jobs in the build. Shorter jobs are aggregated into blocks so they can still be seen in this visualization. If you want to see more details than are available in this visualization, you can run CloudBees Build Acceleration Insight on the annotation file from the build.
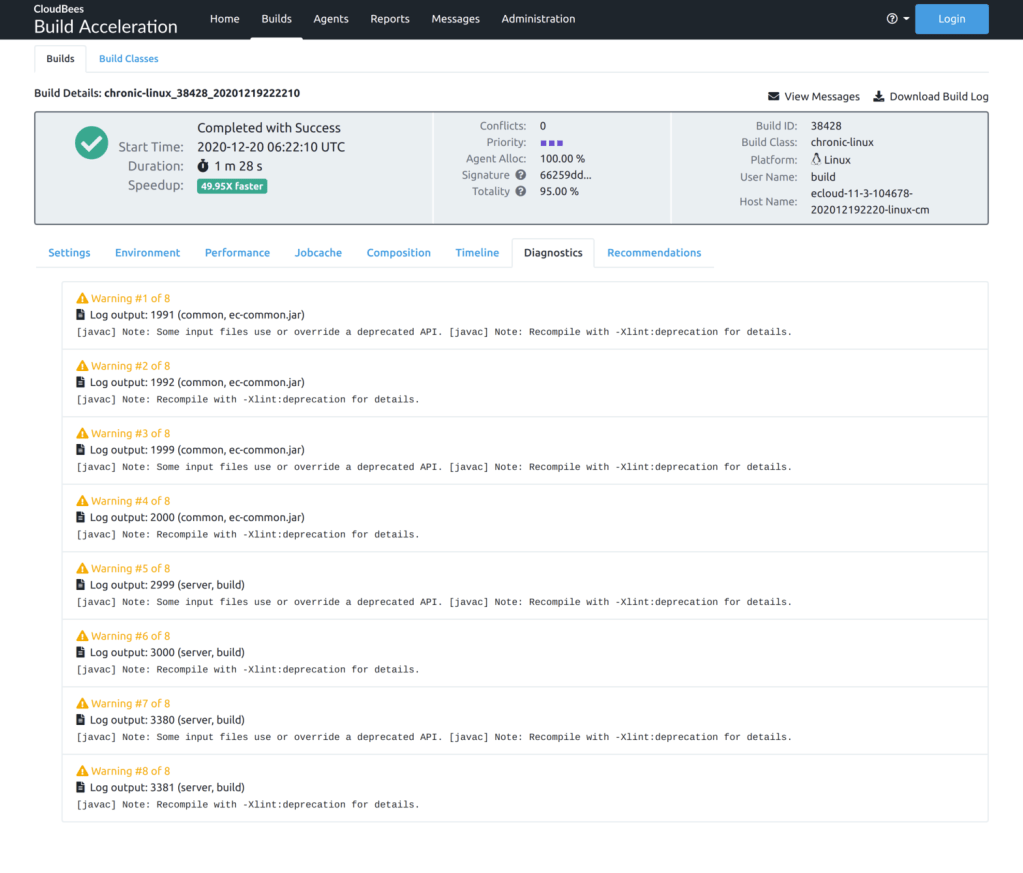
  • The Diagnostics tab presents warnings and error messages culled from the build output log, using analysis similar to that found in CloudBees CD (formerly ElectricFlow).
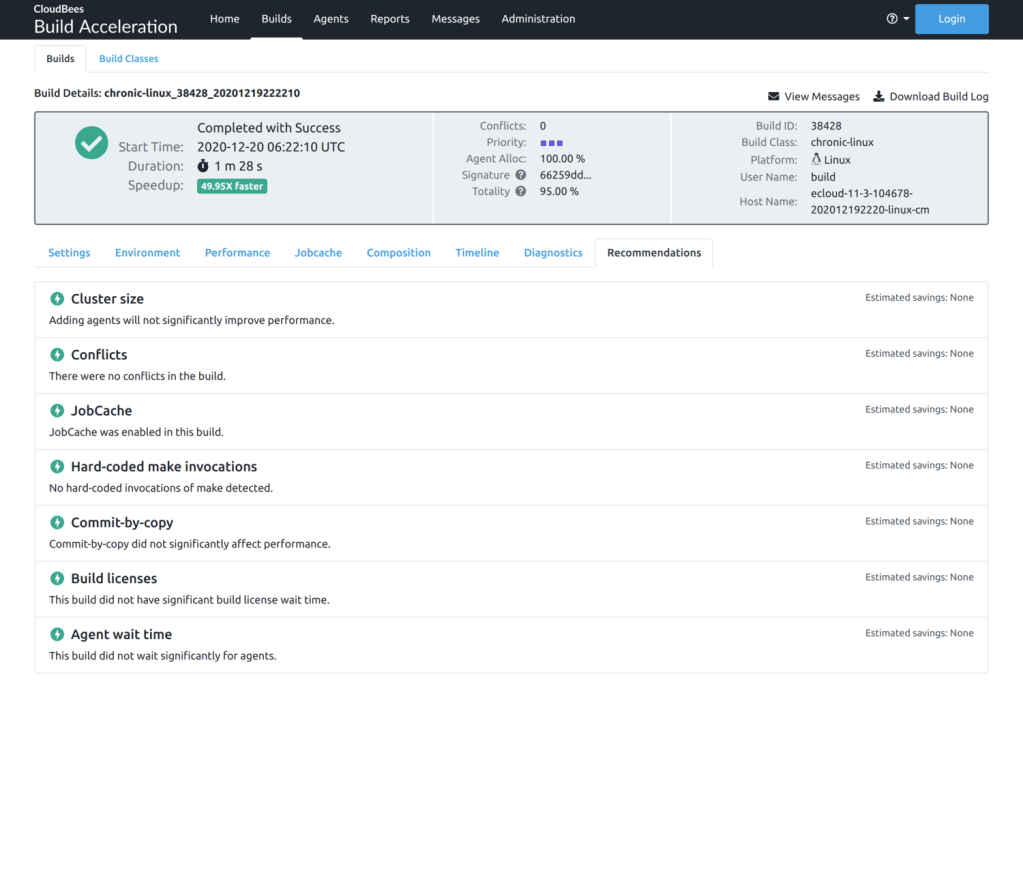
  • Finally, the Recommendations tab presents suggestions for ways to improve build performance and an estimate of the impact of implementing those suggestions. The list is prioritized according to that estimate. Of course this is not an exhaustive list of ways to improve performance — instead, you should see these recommendations as a starting point for build optimization. Today the report checks for several common types of performance gotchas; in the future we hope to add more.

If you’ve used Build Acceleration Insight in the past, some of the information you’ll find in the Build Details page now will seem familiar. The nice thing is that you no longer have to manually remember to run Insight, and you can access this analysis from any browser that can access the Cluster Manager, even for builds that were run on different hosts and for which the annotation file may not be available. I truly believe that having this information easily accessible will enable more users to “self serve” when it comes to performance analysis, effectively making everybody a Build Acceleration “super user”.

Note: in order to use the new Build Details, you must upgrade both the Cluster Manager and emake to 12.0 or later. Enhanced analysis is not available for builds run using older versions of emake.

Build Signature and Totality

Tucked into the Build Details screenshots above you may have noticed a couple additional fields in the header: signature and totality. These new build properties make it possible to identify builds that are building the same stuff, and whether a build is full or incremental:

The signature is simply a hash of the names of all the output targets in the build, in serial order. If you run the same build repeatedly, you should get the same signature for each run. If you add or remove modules or targets in the build, the signature will change. If the builds are entirely different, such as of different packages, the signatures will be different.

The totality of the build reflects the percentage of rule jobs in the build that were determined to be out-of-date during the run. In theory a full-from-scratch build will have a totality of 100%, although many builds have duplicate targets and other quirks that result in the totality being less than that even for a full-from-scratch build. Each build is unique, so you’ll have to observe the behavior of this value in your own builds to know what is normal for your configuration. Conversely, a “no touch” build should have a totality of 0%, but again many builds have rules that are always run, so even in a “no touch” build the totality is not quite 0%. Again, you’ll have to observe the behavior in your builds to understand what is normal for your configuration. In general comparing totality from dissimilar builds (that is, those that have a different signature) is not useful, but you can use it to distinguish full (or mostly full) builds from incremental or no touch builds when the signatures are the same. Remember too that totality is a continuum: if 100% is a full-from-scratch build and 0% is a no touch build, an incremental that rebuilds only a few outputs might have a totality of 10% or 20%, while an incremental that rebuilds many outputs might have a totality of 70% or 80%.

JobCache Enhancements

CloudBees Build Acceleration 12.0 also includes several improvements to the jobcache feature to improve performance, increase cache hit rates and expand the types of work that can be cached. Chief among these is an intelligent hasher for C/C++ source code, which enables emake to ignore comments and blank lines in those files when determining whether an input has changed. That means that these two fragments are considered equivalent:

/* Generated 2020-DEC-15 11:57:32 */
#include "util.h"
static const int DEBUG = 1;
/* Generated 2020-DEC-18 15:12:47 */
#include "util.h"
static const int DEBUG = 1;

Previously a change like this would have caused a jobcache miss — technically correct, but unfortunate since obviously the code in question has not actually changed in a meaningful way. With this enhancement, emake correctly recognizes that fact, and you’ll get a jobcache hit (assuming no other changes, of course).

Along the same lines, we added an intelligent hasher for Unix archive files — .a or .la files. In this case, emake now knows to ignore the timestamps embedded in the archive, while still considering the content of the members of the archive. Again this allows for a greater number of cache hits in practical usage.

Next, we extended the javac jobcache type so it applies to Kotlin compilation in addition to Java compilation. Kotlin is a programming language that is used extensively in the Android ecosystem, and which is interoperable with Java — in fact in most cases Kotlin is compiled into Java byte code. Expanding the scope of jobcache to include Kotlin enables caching of even more work in Android system builds.

Finally, in this release we changed how emake stores timestamp data in jobcache entries. Previously, if a cached job set an explicit timestamp on a file (something like touch -t 202012010000 foo), that timestamp would be recreated precisely as it was saved in the cache, even if the cache was used days or months after it was originally initialized. That lead to some surprising behaviors, because running a build today might result in build outputs with a timestamp from some time far in the past. In turn that caused unwanted rework in incremental builds, because some timestamps were very old, but others (from outputs created by uncached jobs, for example) were current. With this change, emake no longer saves explicit timestamp modifications in the jobcache, so outputs pulled from the cache are always given a timestamp reflecting the time at which the outputs were created in the current build.

Automatically creating output directories

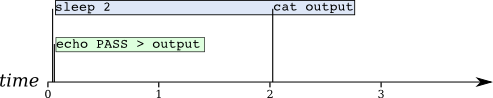
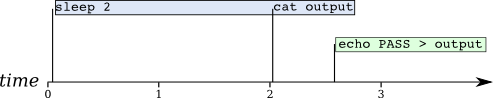
Although there are many other improvements in the 12.0 release, there’s one more in particular that I think warrants a mention, because it directly addresses a problem that many make users contend with: how to efficiently, succinctly, and correctly create parent directories for output targets in the build. This is a topic that has been written about often and which should be familiar to anybody who’s had to maintain a make-based build. Essentially the question is: how can we make sure the directories for outputs in a makefile will be created before the outputs themselves are created? Of course if you fail to create the directories, the build will fail. It’s true there are a variety of ways to solve this in GNU make, but truthfully they are all kind of clunky, requiring some combination of redundant mkdir commands (which waste time), or sentry files (which create clutter), or for the user to remember to add extra prereqs all over the place. Other build tools, like ninja, have a pretty tidy solution: the build tool itself just automatically creates the output directory just before it is needed. This is clean, simple, and efficient — and now, if you use emake, you can get the same behavior for your make-based build by adding --emake-create-output-dirs=1 to your invocation. In this mode, emake will automatically create special jobs to handle making output directories in the most efficient possible way, with no makefile modifications required.

Availability

As you can see, I’m pretty excited about the 12.0 release of CloudBees Build Acceleration. I can’t wait to see how people make use of the new Build Details information to understand and optimize their builds, and I’m always amazed that even after 40 releases we’re still finding ways to make builds faster than ever. I hope you’ll upgrade soon.

CloudBees Build Acceleration 12.0 is available immediately for current users, and new users can download a free trial.

What’s new in ElectricAccelerator 9.1?

We recently released ElectricAccelerator 9.1, the 33rd feature release in the product’s 15-year-and-counting development history. This release includes several enhancements which I’m pleased to share with you: a new look-and-feel, improved scalability, and a new flexible licensing system to accommodate small- and medium-sized teams! Read on for more details.

Cluster Manager Dashboard

The most visible change in 9.1 is the all-new Cluster Manager dashboard, which collects several pieces of information about the health and performance of your cluster in what we hope will be a one-stop-shop for cluster monitoring. We tried to pack in a lot of usable data, while maintaining the clean look-and-feel that is the hallmark of the new Cluster Manager interface:

dashboard_full

The top of the dashboard will look familiar if you ever tried ElectricAccelerator Huddle, where the metrics proved so popular with users that we decided to surface them in the standard Accelerator UI as well. Across the top of the page you’ll find the following information:

Agents The total number of agents in the cluster. If any are offline, a warning icon is shown next to the count. Clicking the icon will show you the bad agents.
Running builds Number of builds currently in progress.
CPU Hours Used The total CPU time used by all builds ever run on the cluster. For example, a build that used 10 agents for 1 hour used a total of 10 CPU-hours.
Developer Hours Saved The total time saved by using Accelerator. For example, if your build takes 10 hours when run serially but just 1 hour with Accelerator, you save 9 hours each time you run that build.
Days Remaining Number of days until your license expires — so you know when to renew.

Below the row of metrics the dashboard is in two columns. On the left you’ll find these sections:

Welcome: a brief description of the major new features in the release you’re using, as well as information about new releases if you’re not running the latest version.

Online Resources: links to sources of help like the ElectricAccelerator Knowledge Base and Ask Electric Cloud, our community Q&A site.

Lightning Lessons: short tutorials and demos to help new users get started using ElectricAccelerator to crush build times.

Finally, in the right-hand column of the dashboard you’ll find some preset reports:

Agent Usage: this graph shows agent availability and demand over the past 24 hours, so you can quickly see if usage has exceeded capacity, indicating that you need to expand your cluster.

Build Duration: here you’ll see the duration of every build run in the past 24 hours, colored according to build class, so you can easily spot aberations. Clicking any of the data points will take you to the details page for that build.

Clean, Modern Cluster Manager Interface

As excited as I am about the new Cluster Manager dashboard, the user interface updates don’t end there. We’ve overhauled the entire CM UI, the first complete overhaul since version 4.0 in 2007. With this release the UI has a modernized look-and-feel, and uses the same visual design elements as ElectricFlow — so we have a consistent design language across Electric Cloud’s suite of products. Functionally the UI is not much changed, although filters are a bit more flexible and easier to use. Rather than belabor the point, take a look at these screenshots of the Builds and Agents pages:

Builds

Agents

Back-end Updates: Java 8 and 64-bit

Accelerator 9.1 includes Cluster Manager improvements under-the-hood as well. First off we attended to some long overdue maintenance by updating from Java 6 to Java 8. This required us to update many of the third-party libraries upon which the Cluster Manager is built, which in turn prompted a variety of source code changes to account for changes in APIs — affecting about 26% of the Java classes in our implementation. For now the primary benefit of this work is improved stability and reliability as we pulled in fixes in those third-party libraries. But in future releases, the groundwork we’ve done in 9.1 will enable us to take advantage of modern language features in Java 8, and to use new third-party Java integrations that have been introduced in the past few years.

The other major back-end change for the Cluster Manager is that it now runs on top of a 64-bit JVM. This enables the CM to more easily manage the large, busy clusters that some users wish to deploy — thousands of agents with hundreds of concurrent builds, with tens of millions of builds executed over the lifetime of the deployment.

Licensing updates

Finally, Accelerator 9.1 includes some changes to the way the product is licensed based on our experience with ElectricAccelerator Huddle, the freemium/low-end version of Accelerator that’s been in public beta for a few years. For small-to-medium-sized teams, Accelerator can be licensed by number of agents and number of concurrent builds, at a price point that I think users will find very reasonable (unfortunately I can’t disclose specific numbers here).

In addition, management of so-called “local agents” has been drastically simplified, again based on our experience with Huddle. To put it simply: local agents — any agent that is running on the same host as emake itself during a build — are now managed via the Cluster Manager, just like any other agent in the cluster. Both the CM and emake will prefer to allocate and use local agents when possible, as these tend to give better performance by avoiding network overhead.

Availability

ElectricAccelerator 9.1 is available immediately for current users via the Electric Cloud ShareFile site. For new users, contact sales@electric-cloud.com for a demo or eval download. Upgrading is recommended for all users.

As always, this release would not have been possible without the outstanding efforts of the ElectricAccelerator Engineering team at Electric Cloud. Thank you all for your contribution!

What’s new in ElectricAccelerator 9.0?

Just a couple months ago, in October 2016, we released ElectricAccelerator 9.0. This version includes some really exciting new functionality and unlocks even more amazing performance than ever before. For the first time since 2008 we added support for a new build tool: ninja, an ultra-fast new make-like build tool and the workhorse at the center of the build for both chromium and Android (yes, that Android). And we’ve continued to expand the JobCache feature — a generalization of the parse avoidance feature introduced in Accelerator 7.0. With Accelerator 9.0 you can cache more types of work, including GCC/G++ compiles, clang compiles, Microsoft cl compiles, javac and javadoc, and Google’s new Jack compiler for Java code. Even better, you can share cached results with other developers to amplify the gains across an entire team. Read on for details.

Ninja emulation

Accelerator 9.0 introduces support for the ninja-based builds. Ninja is a very interesting build tool: conceptually similar to make, but radically simplified (at least so far!). Gone are things like built-in functions, pattern rules, vpath, conditional directives, and all the other things that make it hard to parse and evaluate makefiles quickly. This enables the ninja parser to evaluate “ninja files” unbelievably quickly, but at the cost of making ninja files verbose and ill-suited for creation by hand. Instead, ninja files are typically generated from some other process, such as CMake. The benefit to the end user then is extremely fast incremental builds: for example, in Android 6.0, using the original make-based build system, a no-touch build could take as much as a minute to run even though there’s no work to be done. In Android 7.0, using the new ninja-based build system, the same build can be completed in about 5 seconds!

ElectricAccelerator’s emulation of ninja is, I think, remarkably anticlimactic: to execute a ninja build, simply invoke emake –emake-emulation=ninja. That’s it. Here’s a very simple “Hello, world!” ninja file:

1
2
3
4
rule echo
description = Building $out
command = echo "Hello, world!"
build foo: echo

And the result of running this with emake –emake-emulation=ninja:

1
2
3
4
5
6
$ emake --emake-emulation=ninja
Starting build: local-32601
Building foo
Hello, world!
Finished build: local-32601 Duration: 0:00 (m:s)
$

As I said, it’s utterly uninteresting, which, quixotically, makes it very interesting: the integration is seamless and it “just works”. Even better, by running your ninja build with ElectricAccelerator you automatically and instantly take advantage of all the advanced acceleration and correctness features you’ve come to love about Accelerator: conflict detection, history, schedule optimization, annotation, even jobcache. It all just works.

JobCache Enhancements

In Accelerator 7.0 we introduced parse avoidance, a mechanism for caching the result of makefile parsing in one build in order to accelerate subsequent builds. Once we had shown that this type of caching could dramatically improve build performance we refactored the code behind parse avoidance to create a general purpose caching framework dubbed JobCache and in subsequent releases we’ve steadily expanded the types of work to which jobcache can be applied:

  • Accelerator 7.1: jobcache for Javadoc generation
  • Accelerator 8.0: jobcache for C/C++ compiles using clang/gcc/g++ (comparable to, but better than, ccache)
  • Accelerator 8.1: jobcache for C/C++ compiles using Microsoft cl

In Accelerator 9.0 we’ve expanded the reach of jobcache in two ways. First, we added support for caching javac and Jack compiles. Next, we added shared jobcache, which enables a team of developers to leverage jobcache collectively and reliably, eliminating redundant work across the entire team.

With shared jobcache, the team designates a “blessed” or “golden” build process to populate the cache — typically the nightly or continuous integration builds. This build simply uses jobcache as normal, using –emake-assetdir to specify a location on a shared filesystem to host the cache. Then, each developer explicitly requests to use the shared cache by adding –emake-shared-assetdir to the command-line when they invoke emake, specifying the same location. Once enabled, emake uses both the shared cache and the private cache during the build. For each job that uses jobcache:

  1. Check the shared jobcache for a matching entry.
    1. If a match is found in the shared jobcache, use it. Done!
    2. If a match is not found in the shared jobcache, continue.
  2. Check the private jobcache for a matching entry.
    1. If a match is found in the private jobcache, use it. Done!
    2. If a match is not found in the private jobcache, continue.
  3. Run the job as normal
  4. Save the result to the private cache

Note that the shared cache is never written to by the developers’ builds: updates are only saved in the private cache. In this way we can ensure that developers’ builds to not litter the shared cache with one-off or user-specific cache entries. Typically we expect that developers will see very good cache hit rates against the shared cache, perhaps 95% or better, since each developer modifies only a small fraction of the total source code at once. Thus shared jobcache multiples the savings from jobcache by the size of the team.

Dynamic file patching

The final feature of interest in Accelerator 9.0 is dynamic file patching. This is a mechanism by which emake can patch files on the fly as they are referenced during the build, based on the name, size and MD5 checksum of the original. This feature enables users to tweak build scripts or makefiles in order to improve performance or compatibility with Accelerator — critical in environments where there is limited ability to modify the original files directly.

Looking forward to 9.1

Accelerator 9.0 contains some really tremendous new features: the first new build tool emulation in almost a decade; shared jobcache; on-the-fly patching for those challenging environments where no other option will do. But as always, my eye is already on the next horizon: Accelerator 9.1. We have some big plans relating to performance and ease-of-use. It will require a lot of hard work but I think we have the right team to do it. Stay tuned.

Accelerator 9.0 is available immediately for existing customers — support@electric-cloud.com to get the bits. New users can download ElectricAccelerator Huddle to take it for a test drive, or contact sales@electric-cloud.com for an evaluation of the enterprise edition.

The ElectricAccelerator 7.2 “Ship It!” Award

Naturally with the release of ElectricAccelerator 7.2 a few weeks ago it’s time for another Accelerator “Ship It!” award. In keeping with our tradition, I gave each team member a LEGO figure that symbolized the release to me in some way, along with a a custom trading card giving the vital details: version, release date, and key features. Like a baseball card, the back is filled with a team roster and release statistics.

There are some great improvements in Accelerator 7.2 but there’s no particular unifying theme, so it was quite a challenge to choose a suitable minifig. One thing that stood out is that between the time management asked engineering to create a 7.2 release and the time that development was complete was only about three weeks. At the time we were actually in the midst of development on another release entirely, with a different set of new features. The 7.2 release was very much a, “Hey couldn’t you also cut a release right now while you’re at it?” And we did. Maybe it’s not as impressive as those guys that can cut a release every minute of every day, but for a team that usually does releases on a six-month cadence, a 3-week turnaround sounds like continuous delivery to me.

One thing enabled us to turn around the release that quickly: our code is (nearly) always shippable. That’s what led me to the minifig for this release: the sea captain, who’s always ready to “ship out” on short notice. Here’s the trading card that accompanied the figure:

Accelerator 7.2 "Ship It!" Card Front - click for larger version

Accelerator 7.2 “Ship It!” Card Front – click for full-size version

Accelerator 7.2 "Ship It!" Card Back - click for larger version

Accelerator 7.2 “Ship It!” Card Back – click for full-size version

Like the 7.1 card, the back of the 7.2 card incorporates stats for the current release, contextualized by stats for several previous releases:

  • Number of days in development. This is just the number of days since the previous feature release — it is assumed that whatever features are in the new release, we started working on them more-or-less after the last release went out.
  • JIRA issues closed.
  • Total KLOC. This metric gives the total size of the Accelerator code base in thousands of lines of code, as measured with the excellent Count Lines of Code utility by Al Danial. This measurement excludes comments and whitespace.
  • Change in KLOC. This is simply the arithmetic difference between the total KLOC for each release and its predecessor.

As always, my sincere gratitude goes to everybody on the Accelerator team, without whom this release would not have been. Thank you!

What’s new in ElectricAccelerator 7.2?

Wow, time flies! Another six months has come and gone, which means it’s time for another ElectricAccelerator feature release. Right on cue, ElectricAccelerator 7.2 dropped a couple weeks back on April 17, 2014. There’s no unifying theme to this release — actually we’re in the middle of a much more ambitious project that I can’t say much about quite yet, but over the last several months we’ve made a number of improvements to Accelerator core functionality, and we’re eager to get those out users. Thus we have the 7.2 release, with the following marquee features: dramatic Linux performance improvements for certain use cases, a key enhancement to our parse avoidance feature to improve accuracy, and expanded Linux platform support. Read on for the details.

Linux performance improvements

Accelerator 7.2 incorporates two performance improvements for Linux-based builds. The first is a redesign of the integration between the Electric File System (EFS) and the Linux kernel, which reduces lock contention in the EFS. Consequently, any build job that makes concurrent accesses to the filesystem should see some performance improvement. In one example, a build that executed two tar processes simultaneously in one job saw runtime drop from 11 minutes with Accelerator 7.1 to just 6 minutes with Accelerator 7.2, nearly 2x faster!

The second improvement is full support for the Linux d_type extension to the readdir() system call. On most Unix and Unix-like systems, the readdir() system call only gives the application programmer a couple pieces of information: the names of the files in a directory, and the inode number for those files. On Linux, filesystems may also include file type information in the results, which enables programs to operate more efficiently in some cases as they can avoid the overhead of an addition stat() call to get the file type. On a local filesystem that optimization is interesting but not necessarily game-changing; but with a distributed network filesystem like the EFS, that optimization can result in enormous improvements. In our benchmarks we saw jobs using find to scan large directory structures execute nearly 9x faster with Accelerator 7.2 versus Accelerator 7.1

Parse avoidance update

For large builds with many or complicated makefiles, Accelerator’s parse avoidance feature is a game-changer by dramatically reducing the time necessary to read and interpret makefiles at the start of a build. On the Android KitKat open-source build, parse avoidance reduces a 4 minute parse job to about 5 seconds — nearly 50x faster!. Since its introduction in Accelerator 7.0, parse avoidance has delivered jaw-dropping improvements like that in a wide variety of builds.

But use of this feature has been problematic in one specific use case: makefiles that use wildcards in prerequisite lists, with either $(wildcard) or $(shell). In certain circumstances this makefile anti-pattern could cause emake to produce “false positives” from the parse avoidance cache, such that emake would incorrectly use a previously cached parse result when it should have instead reparsed the makefile. In Accelerator 7.2 we’ve extended the #pragma cache syntax so that you can inform emake of the wildcard patterns to consider when determining cache suitability. This will enable even more users to enjoy the benefits of parse avoidance, without sacrificing reliability or performance. Usage instructions can be found in the Electric Make User’s Guide.

New platform support

Finally, with Accelerator 7.2 we’ve further expanded our already sweeping platform support to include RedHat Enterprise Linux 6.5, Ubuntu 13.04 and Windows Server 2012. This may seem like a modest increment, but I’m particularly excited about this update not for the what but for the who: you see, this is the first time that somebody other than myself made all the updates needed to support a new version of Linux, start to finish. With another set of hands to do that work we should be able to add support for new Linux platforms much more quickly in the future, which is welcome news indeed (thanks, Tim)!

What’s next?

Years ago, I thought that we would eventually get to the point that Accelerator was “done” and we’d have nothing left to do. How young and foolish I was! In reality, it seems that the TODO list only gets longer and longer. We’re still working hard on the “buddy cluster” concept, as well as Bitbake and ninja integration. And of course, we’re always working to improve performance — more on that in a future post.

ElectricAccelerator 7.2 is available immediately for existing customers. Contact support@electric-cloud.com to get the bits. New users can contact sales@electric-cloud.com for a evaluation.

The ElectricAccelerator 7.1 “Ship It!” Award

Well, it took a lot longer than I’d like, but at last I can reveal the Accelerator 7.1 “Ship It!” award. This is the fifth time I’ve commemorated our releases in this fashion, which I think is pretty cool itself.

Since this release again focused on performance, I picked a daring old-timey airplane pilot — the sort of guy you might have found behind the controls of a Sopwith Camel, with a maximum speed of about 115mph. Here’s the trading card that accompanied the figure:

Accelerator 7.1 "Ship It!" Card Front - click for larger version

Accelerator 7.1 “Ship It!” Card Front – click for larger version

Accelerator 7.1 "Ship It!" Card Back - click for larger version

Accelerator 7.1 “Ship It!” Card Back – click for larger version

I included release metrics again, but where the 7.0 card showed just 10 data points, the 7.1 card packs in a whopping 48 by including data for the 12 most recent releases across four categories;

  • Number of days in development.
  • JIRA issues closed.
  • Total KLOC. This metric gives the total size of the Accelerator code base in thousands of lines of code, as measured with the excellent Count Lines of Code utility by Al Danial. This measurement excludes comments and whitespace.
  • Change in KLOC. This is simply the arithmetic difference between the total KLOC for each release and its predecessor.

Again, my sincere gratitude goes to everybody on the Accelerator team. Well done and thank you!

What’s new in ElectricAccelerator 7.1

ElectricAccelerator 7.1 hit the streets a last month, on October 10, just six months after the 7.0 release in April. There are some really cool new features in this release, which picks up right where 7.0 left off by adding even more ground-breaking performance features: schedule optimization and Javadoc caching. Here’s a quick look at each.

Schedule Optimization

The idea behind schedule optimization is really simple: we can reduce overall build duration if we’re smarter about the order in which jobs are run. In essense, it’s about packing the jobs in tighter, eliminating idle time in the middle of the build and reducing the “ragged right edge”. Here’s a side-by-side comparison of the same build, first using normal scheduling and then using schedule optimization. You can easily see that schedule optimization made the second build faster — an 11% improvement in this small, real-world example:

Build using naive scheduling -- click to view full size

Build using naive scheduling — click to view full size

Build using schedule optimization - click to view full size

Build using schedule optimization – click to view full size

If you study the two runs more closely, you can see how schedule optimization produced this improvement: key jobs, in particular the longest jobs, were started earlier. As a result, idle time in the middle of the build was reduced or eliminated entirely, and the right edge is much less uneven. But the best part? It’s completely automatic: all you have to do is run the build once for emake to learn its performance profile. Every subsequent build will leverage that data to improve build performance, almost like magic.

Not convinced? Here’s a look at the impact of schedule optimization on another, much bigger proprietary build (serial build time 18h25m). The build is already highly parallelizable and achieves an impressive 37.2x speedup with 48 agents — but schedule optimization can reduce the build duration by nearly 25% more, bringing to total speedup on 48 agents to an eye-popping 47.5x!

Build duration with naive and optimized scheduling

Build duration with naive and optimized scheduling

There’s another interesting angle to schedule optimization though. Most people will take the performance gains and use them to get a faster build on the same hardware. But you could go the other direction just as easily — keep the same build duration, but do it with dramatically less hardware. The following graph quantifies the savings, in terms of cores needed to achieve a particular build duration. Suppose we set a target build duration of 30 minutes. With naive scheduling, we’d need 48 agents to meet that target. With schedule optimization, we need only 38.

Resource requirements with naive and optimized scheduling - click for full size

Resource requirements with naive and optimized scheduling – click for full size

I’m really excited about schedule optimization, because it’s one of those rare features that give you something for nothing. It’s also been a long time coming — the idea was originally conceived of over three years ago, and it’s only now that we were able to bring it to fruition.

Schedule optimization works with emake on all supported platforms, with all emulation modes. It is not currently available for use with electrify.

Javadoc caching

The second major feature in Accelerator 7.1 is Javadoc caching. Again, it’s a simple idea: think “ccache”, but for Javadoc instead of compiles. This is the next phase in the evolution of Accelerator’s output reuse initiative, which began in the 7.0 release with parse avoidance. Like any output reuse feature, Javadoc caching works by capturing the product of a Javadoc invocation and storing it in a cache indexed by a hash of the inputs used — including the Java files themselves, the environment variables, and the command-line. In subsequent builds, emake will check those inputs again and if it computes the same hash, emake will used the cached results instead of running Javadoc again. On big Javadoc jobs, this can produce significant savings. For example, in the Android “Jelly Bean” open-source build, the main Javadoc invocation usually takes about five minutes. With Javadoc caching in Accelerator 7.1, that job runs in only about one minute — an 80% reduction! In turn that gives us a full one minute reduction in the overall build time, dropping the build from 13 minutes to 12 — nearly a 10% improvement:

Uncached Javadoc job in Android build - click for full image

Uncached Javadoc job in Android build – click for full image

Cached Javadoc job in Android build - click for full build

Cached Javadoc job in Android build – click for full image

Javadoc caching is available on Solaris and Linux only in Accelerator 7.1.

Looking ahead

I hope you’re as excited about Accelerator 7.1 as I am — for the second time this year, we’re bringing revolutionary new performance features to the table. But of course our work is never done. We’ve been hard at work on the “buddy cluster” concept for the next release of Accelerator. Hopefully I’ll be able to share some screenshots of that here before the end of the year. We’re also exploring acceleration for Bitbake builds like the Yocto Project. And last, but certainly not least, we’ll soon start fleshing out the next phase of output reuse in Accelerator — caching compiler invocations. Stay tuned!

The inverted parallel build bug

At some point most of you have encountered “the” parallel build problem: a build that works just fine when run serially, but breaks sometimes when run in parallel. You may have read my blog about how ElectricAccelerator automatically solves the classic parallel build problem. Recently I ran into the opposite problem in a customer’s build: a build that “works” when run in parallel, but breaks when run serially! If you’re lucky, this build defect will just cause occasional build failures. If you’re unlucky, it will silently corrupt your build output at random. With traditional GNU make this nasty bug is a nightmare to track down — if you even know that its present!

In contrast, the unique features in ElectricAccelerator make it trivial to find the defect — some might even say it’s fun (well, if you’re like me and you enjoy using powerful tools to do sophisticated analysis without breaking a sweat!). Read on to see how ElectricAccelerator makes it easy to diagnose and fix bugs in your build.

The inverted parallel build bug

Let’s start with a concrete example. Here’s a simple Makefile which (appears to) work when run in parallel, but which consistently fails serially:

1
2
3
4
5
6
7
8
all: reader writer
reader:
sleep 2
cat output
writer:
echo PASS > output

Assuming that output does not exist, executing this makefile serially will always produce an error:

$ gmake
sleep 2
cat output
cat: output: No such file or directory
gmake: *** [reader] Error 1

But if you execute this makefile in parallel, it appears to work!:

$ gmake -j 2
sleep 2
echo PASS > output
cat output
PASS

If we visualize the execution of these commands it’s easy to see why the parallel build seems to work:

Sample parallel execution timeline

At the beginning of the build, both reader and writer are started, more-or-less at the same time, because we told gmake to run two jobs at a time. reader has two commands, which are executed serially according to the semantics of make. While the sleep 2 is executing, the echo command in writer runs and completes. When the cat command in reader starts, it succeeds because output is ready-to-go.

Parallel execution is no guarantee

Some people will look at that explanation and think “Got it — always run this thing in parallel and we’re good!” Of course, you can’t really be 100% sure that everybody will remember to run the makefile in parallel. But even if you could, there’s a flaw in that reasoning: basically, your build has a race condition, and there’s no guarantee that you’ll “win” the race every time. For example, if your build server is heavily loaded, the sequence of events might look like this instead:

Alternative parallel execution timeline

Here, writer doesn’t get started until after the sleep command has finished — too late to save the cat command from failure.

Build failure is not the worst outcome

Before we move on to finding and fixing problems like this, let’s take a quick look at one more failure mode: incremental builds. In particular, check out what happens if output exists before the build starts, but with incorrect content (for example, stale data from an earlier build):

$ echo '*** FAIL ***' > output
$ gmake
sleep 2
cat output
*** FAIL ***
echo PASS > output
$ echo $?
0

That’s right — the build “succeeded”, because it produced no error messages and exited with a zero exit code. And yet, it produced completely bogus output. Ouch!

Somebody save me!

If you’re using ordinary GNU make, you’re in for a world of hurt with a problem like this. First, the only way to consistently reproduce the problem is to run the entire build serially — of course that probably takes a long time, or you wouldn’t have been using parallel builds in the first place. Second, there are no diagnostics built into gmake that could help you identify which job produces output. One option is to use strace to monitor filesystem accesses, but that will generate a mountain of data in a not-very-usable format. Plus, it imposes a substantial performance penalty — on top of the hit you’d already take for running the build serially. Yuck!

If you’re using Electric Make, this problem is embarrassingly easy to solve thanks to emake’s core features:

  • Consistent results: emake mimics serial execution with gmake, so you’ll always get a consistent result with this build. That means it will fail, the same way, every time, which means you’ll discover the problem immediately after it is introduced, not months or years later after it has become nearly impossible to tell which Makefile change introduced the defect.
  • Parallel speed: emake’s results match those of a serial gmake build, but its performance is more like that of a parallel gmake build — better, in most cases.
  • Annotated build logs: emake can generate an XML-enhanced version of the build output log which contains a record of every file accessed by every job in the build. This annotation file can easily be mined to identify pairs of jobs where the reader preceeds the writer.

You can use any general purpose XML parsing library to read annotation files, but it’s easy to use annolib, the high-performance annotation processing library we wrote to facilitate this kind of analysis. Since annolib is built into ElectricInsight, the easiest way to use it is to write the analysis as a custom Insight report. All you need to do is iterate through the files referenced in the build, looking for read operations (or, in this case, failed lookups) preceeding a write operation. Here’s the code:

global anno
set instances [list]

# Iterate over the files referenced in the build...

foreach filename [$anno files] {
    set readers [list]

    # Iterate over the operations performed on the file...

    foreach tuple [$anno file operations $filename] {
        foreach {job op dummy} $tuple { break }
        if { $op == "read" || $op == "failedlookup" } {
            # If this is a read operation, note the job that did the read.

            lappend readers $job
        } elseif {$op == "create" || $op == "modify" || $op == "truncate"} {
            # If this is a write operation but earlier jobs already read
            # the file, we've found a read-before-write instance.

            if { [llength $readers] } {
                lappend instances [list $readers $job $filename]
            }

            # After we see a write on this file we can move on to the next.

            break
        }
    }
}

# For each instance, print the filename, the writer, and each reader.

set result ""
foreach instance $instances {
    foreach {readers writer filename} $instance { break }
    set writerName [$anno job name $writer]
    set writerFile [$anno job makefile $writer]
    set writerLine [$anno job line $writer]
    append result "FILENAME:\n  $filename\n"
    append result "WRITER  :\n  $writerName ($writerFile:$writerLine)\n"
    append result "READERS :\n"
    foreach reader $readers {
        set readerName [$anno job name $reader]
        set readerFile [$anno job makefile $reader]
        set readerLine [$anno job line $reader]
        append result "  $readerName ($readerFile:$readerLine)\n"
    }
}

With a bit of additional boilerplate you can run this report from the command-line with Insight 4.0 (currently in limited beta). A couple notes on usage: you should instruct emake to generate lookup-level annotation, by adding –emake-annodetail=lookup to your invocation. And, you should run the build with the -k (keep-going) option — otherwise, the error in reader will prevent writer from running, and emake will not record filesystem usage for it. Once you have a suitable annotation file, here’s how the report looks for this build:

$ einsight --report=ReadBeforeWrite emake.xml
done.
FILENAME:
/home/ericm/test/output
WRITER :
writer (Makefile:7)
READERS :
reader (Makefile:3)

Voila! We’ve pinpointed the problem with barely 50 lines of code (including comments!). You can even see a solution: add writer as a prerequisite of reader, on line 3 of Makefile.

Show me what you can do with ElectricAccelerator

As you’ve seen, ElectricAccelerator makes it easy to identify and correct build problems that would otherwise be nearly impossible to root out. Hopefully you also see that this is just the tip of the iceberg — with consistent fast builds and the treasure trove of data available in annotation files, what other analysis could you do? To get started, you can download a free trial of ElectricAccelerator Developer Edition and check out the reports in ElectricInsight. You can also download the Read Before Write report for ElectricInsight from my GitHub repo. If you come up with something cool, tell me about it in the comments!

try_eade_button2

The ElectricAccelerator 7.0 “Ship It!” Award

With ElectricAccelerator 7.0 out the door, it’s finally time for the moment you’ve all been waiting for: the unveiling of the Accelerator 7.0 “Ship It!” award. This time I picked the Clockwork Android, in light of our emphasis on Android build performance. Here’s the trading card that accompanied the figure:

BEEP BOP BOOP

BEEP BOP BOOP

metrics metrics metrics metrics

metrics metrics metrics metrics

As with the 6.2 award, I included some metrics about the release:

  • Number of days in development. This release was relatively long compared to our other releases — not quite our longest development cycle, but close. That’s partly because this release encompassed the Thanksgiving and Christmas seasons, which typically costs us 3-4 weeks of development and testing time. We also deliberately pushed out the release date about 2 weeks to incorporate feedback from beta testers.
  • JIRA issues closed. We resolved 185 issues in this release. That’s double what we had in 6.2, and it includes some really cool new features.
  • Performance improvement. Since this release was all about performance, it made sense to include the data that proves our success. I had some trouble finding a good way to visualize the improvement, but I’m happy with the finished product.

Of course, none of the achievements in Accelerator 7.0 would have been possible without the hard work and dedication of the incredibly talented Accelerator team. Thank you all!

What’s new in ElectricAccelerator 7.0

ElectricAccelerator 7.0 was officially released a couple weeks ago now, on April 12, 2013. This version, our 26th feature release in 11 years, incorporates performance features that are truly nothing less than revolutionary: dependency optimization and parse avoidance. To my knowledge, no other build tool in the world has comparable functionality, is working on comparable functionality or is even capable of adding such functionality. Together these features have enabled us to dramatically cut Android 4.1.1 (Jelly Bean) build times, compared to Accelerator 6.2:

  • Full, from-scratch builds are 35% faster
  • “No touch” incremental builds are an astonishing 89% faster

In fact, even on this highly optimized, parallel-friendly build, Accelerator 7.0 is faster than GNU make, on the same number of cores. On a 48-core system gmake -j 48 builds Android 4.1.1 in 15 minutes. Accelerator 7.0 on the same system? 12 minutes, 21 seconds: 17.5% faster.

Read on for more information about the key new features in ElectricAccelerator 7.0.

Dependency optimization: use only what you need

Dependency optimization is a new application of the data that is used to power Accelerator’s conflict detection and correction features. But where conflict detection is all about finding missing dependencies in makefiles, dependency optimization is focused on finding surplus dependencies, which drag down build performance by needlessly limiting parallelism. Here’s a simple example:

1
2
3
4
5
foo: bar
@echo abc > foo && sleep 10
bar:
@echo def > bar && sleep 10

In this makefile you can easily see that the dependency between foo and bar is superfluous. Unfortunately GNU make is shackled by the dependencies specified in the makefile and is thus obliged to run the two jobs serially. In contrast, with dependency optimization enabled emake can detect this inefficiency and ignore the unnecessary dependency — so foo and bar will run in parallel.

Obviously you could trivially fix this simple makefile, but in real-world builds that may be difficult or impossible to do manually. For example, in the Android 4.1.1 build, there are about 2 million explicitly specified dependencies in the makefiles. For a typical variant build, only about 300 thousand are really required: over 85% of the dependencies are unnecessary. And that's in the Android build, which is regarded by some as a paragon of parallel-build cleanliness — imagine the opportunities for improvement in builds that don't have Google's resources to devote to the problem.

To enable dependency optimization in your builds, add --emake-optimize-deps=1 to your emake command-line. The first build with that option enabled will "learn" the characteristics of the build; the second and subsequent builds will use that information to improve performance.

Parse avoidance: the fastest job is the one you don't have to do

A common complaint with large build systems is incremental build performance — specifically, the long lag between the time that the user invokes make and the time that make starts the first compile. Some have even gone so far as to invent entirely new build tools with a specific focus on this problem. Parse avoidance delivers similar performance gains without requiring the painful (perhaps impossible!) conversion to a new build tool. For example, a "no touch" incremental build of Android 4.1.1 takes close to 5 minutes with Accelerator 6.2, but only about 30 seconds with Accelerator 7.0.

On complex builds, a large portion of the lag comes from parsing makefiles. The net result of that effort is a dependency graph annotated with targets and the commands needed to generate them. The core idea underpinning parse avoidance is the realization that we need not redo that work on every build. Most of the time, the dependency graph, et al, is unchanged from one build to the next. Why not cache the result of the parse and reuse it in the next build? So that's what we did.

To enable parse avoidance in your builds, add --emake-parse-avoidance=1 to your emake command-line. The first build with that option will generate a parse result to add to the cache; the second and subsequent builds will reload the cached result in lieu of reparsing the makefiles from scratch.

Other goodies

In addition to the marquee features, Accelerator 7.0 includes dozens of other improvements. Here are some of the highlights:

  • Limited GNU make 3.82 support. emake now allows assignment modifiers (like ?=, etc.) on define-style variable definitions, when --emake-emulation=gmake3.82
  • Order-only prerequisites in NMAKE emulation mode. GNU make introduced the concept of order-only prerequisites in 3.80. With this release we've extended our NMAKE emulation with the same concept.
  • Enhancements to electrify. The biggest improvement is the ability to match full command-lines to decide whether or not a particular command should be executed remotely (Linux only). Previously, electrify could only match against the process name.

What's next?

In my opinion, Accelerator 7.0 is the most exciting release we've put out in close to two years, with truly ground-breaking new functionality and performance improvements. It's not often that you can legitimately claim double-digit percentage performance improvements in a mature product. I'm incredibly proud of my team for this accomplishment.

With that said: there's always room to do more. We're already gearing up for the next release. The exact release content is not yet nailed down, but on the short list of candidates is a new job scheduler, to enable still better performance; "buddy cluster" facilities, to allow the use of Accelerator without requiring dedicated hardware; and possibly some form of acceleration for Maven-based builds. Let's go!