Schedule Optimization in CloudBees CD

Recently I spent some time redesigning and optimizing the continuous integration (CI) process used to build and test a large software project which I’ll call ZipGit here. The ZipGit CI process is implemented in CloudBees CD, a powerful general purpose process automation system most often used to implement continuous integration and continuous deployment workflows. I used several common — and a few not-so-common — strategies to slash the time to complete a full CI run on all platforms from over 21 hours to under 3 hours. In this blog I’ll show how you can apply one of those not-so-common strategies, called schedule optimization, to your own CloudBees CD-based processes, and shave double-digit percentages off the elapsed time.

What is schedule optimization?

Schedule optimization is a simple idea: in a resource-constrained environment, you can reduce the total time required to execute the tasks in a parallel workload by intelligently choosing the order in which those tasks are started. Consider a simple example with 4 independent tasks that could be run in parallel:

  • Task A takes 17 minutes to complete.
  • Task B takes 12 minutes.
  • Task C takes 31 minutes.
  • Task D takes 65 minutes.

If we have only two resources on which to run these tasks and we naively run them in the order they’re listed above, we can expect that initially task A and task B start in parallel. When task B finishes after 12 minutes, task C starts in its place. When task A finishes after 17 minutes (5 minutes after B), it is replaced by task D. Here’s a quick visualization of this execution order, which makes the problem opportunity clear:

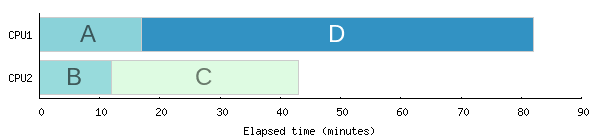
The total elapsed time is 82 minutes — literally the sum of the durations of tasks A and D. But you can easily see that if we rearrange things a bit, we can reduce that elapsed time. When the tasks are truly independent, we need only start them in longest-first order. In this example that means starting tasks D and C first, rather than A and B. When task C finishes at 31 minutes, it is replaced by task A, the next longest task. When task A finishes 17 minutes later, it is replaced by task B. This gives us a significant improvement in the total elapsed time:

With this optimized ordering, all of the tasks are finished after just 65 minutes. That’s a 20% improvement, without adding resources or modifying the tasks themselves in any way! We simply made better use of the resources we had available. This is the central idea of schedule optimization: be smarter about the order in which a set of parallelizable tasks are started in order to reduce the total elapsed time required to complete those tasks.

Note that schedule optimization has no effect if you have only one resource and can thus run only one task at a time. Likewise schedule optimization has no effect if you have as many resources as you do tasks — in that case, you can just run all the tasks at once, and the total runtime will naturally be as long as the single longest task.

Finally, note that if there are dependencies between the tasks then schedule optimization is considerably more difficult as it requires a deep understanding of those dependencies to do correctly. I won’t get into that more complex scenario here; fortunately, in the ZipGit CI process and many other real-world examples, you really do have a collection of independent tasks, so the simple longest-first algorithm works well.

Optimization opportunities in ZipGit CI

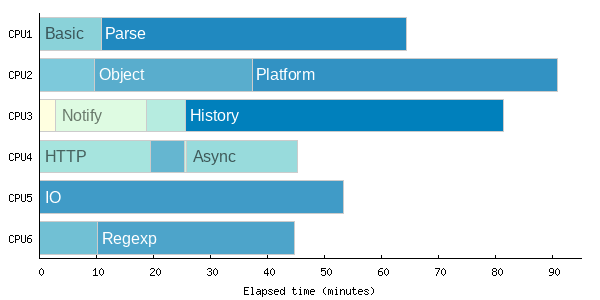
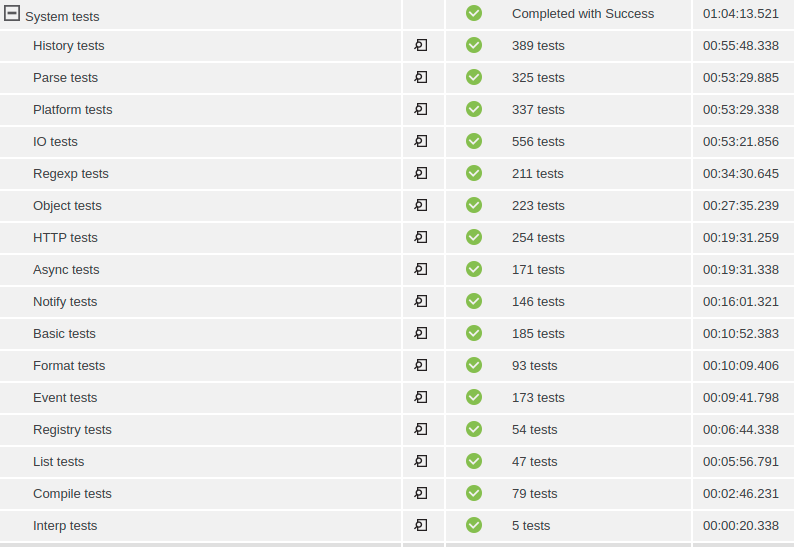
After adopting parallel execution throughout the ZipGit CI process I noticed a set of steps that was an ideal candidate for schedule optimization: the system tests. Running these 16 independent test steps in parallel on a pool of 6 resources already reduced the duration more than 4x, from over 6 hours to 1½ hours:

The total elapsed time is shown in the top row here: 01:30:45.756. That’s a terrific improvement from the original 6+ hours! But because CloudBees CD dispatches parallel steps in declaration order, or literally the order in which the steps are specified in the procedure definition, the overall execution time is not optimal. You can see in the details view that several long steps happen to be near the end of the list, like the Platform and History test suites. Because they’re listed near the end, they will get started later in the process. Indeed if we visualize the execution of all of the system test steps, the inefficiency is easily seen:

Adaptive Schedule Optimization in CloudBees CD

Obviously we could manually reorder the steps in the procedure definition to eliminate this inefficiency — and for some use cases that will be the easiest and most expedient solution! But I find that approach tedious, error prone, and undesirable because it will not adapt to changes in the duration of the steps. Instead, we can use CloudBees CD properties and the CloudBees CD Perl API to dynamically adjust the order on every run of the CI process, so that we always get optimal results. In essence, we can build a dynamic, adaptive schedule optimizer.

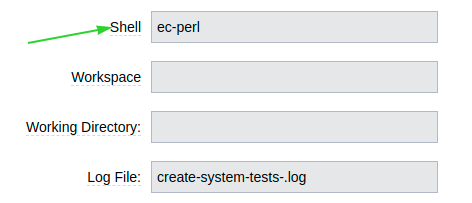
To begin, we have to create a new Command step, then set the Shell option to ec-perl:

Now we just need to write some Perl code to determine the correct ordering and create the steps in that order — remember, CloudBees CD will start the steps in declaration order, so we just have to make sure they are declared in our preferred order! I’m going to show each piece of the implementation separately so I can explain what’s going on, but ultimately all of this code will go in the Command(s) field of the step we’re creating:

I’ve already added the boilerplate declarations that I use in any ec-perl script. Next we’ll create a list that contains enough information for us to actually create the steps later. We’ll use this list to define the ordering of the steps. For each step we define a few attributes:

  • name: a unique, memorable identifier for the step. This will be used later to find historical timing data for the step.
  • label: a display name for the step. This will be shown in the UI when viewing the job details.
  • command: the actual commands to run for the step. In ZipGit most of the system test steps actually have roughly the same invocation so this is straightforward, but some have different requirements as you can see. In your processes obviously you can make the commands as complex as you like, even defining the commands for each step individually if necessary.
my @steps = ();

# Most system tests use the same invocation commands, parameterized.
# Add those to @steps.

foreach ("Basic",    "Parse",   "Event",  "Object",
         "Platform", "Compile", "Notify", "Registry",
         "History",  "List",    "Interp", "Async",
         "IO",       "Format",  "Regexp") {
    my $name = $_;
    push @steps, { name    => $name,
                   label   => $name . " tests",
                   command => "gmake -C src test SUITE=" . lc($name) };
}

# HTTP tests requires that we start a test HTTP server before running the
# tests, so we can't handle it in the loop above.  Add it now.

my $httpCommand = <<"END_COMMAND";
./scripts/startHTTP.sh 8080 \\
    && gmake -C src test SUITE=http TESTPORT=8080 \\
    && ./scripts/stopHTTP.sh 8080
END_COMMAND

push @steps, { name    => "HTTP",
               label   => "HTTP tests",
               command => $httpCommand };

With the list of steps initialized, we can fetch historical timing data for each step. To facilitate this I used a property sheet on the project containing a property that tracks the historical runtime for each test step, at whole second resolution. Here we simply fetch the current value and add it to the step descriptions. If there is no historical data for a step, a value of zero is used. This makes the implementation robust in the face of changes to the set of steps being run:

# Get historical timing data for each step.

foreach my $step (@steps) {
    my $length = 0;
    my $lengthProperty = $ec->getProperty("/myProject/systemtest/$step->{name}");
    if ($lengthProperty) {
        my $lengthString = $lengthProperty->findvalue("//value");
        if (length $lengthString) {
            $length = int($lengthString);
        }
    }
    $step->{length} = $length;
}

Once we have the historical length data, we simply sort the steps according to their length, so the longest is first:

# Sort the steps by decreasing length, so the longest step is first.

@steps = sort { $b->{length} <=> $a->{length} } @steps;

Now we just create the steps in the order we’ve computed, using the createJobStep API. In addition, for each step we append commands to update the timing data upon the successful completion of the step. You can use whatever policy you like to decide how to update the data; in this case I chose to give greater weight to the historical data to help compensate for minor fluctuations in the runtime from one run to the next. Note that all of the steps created will be children of the step running this Perl code, and that we are careful to mark them as eligible for parallel execution. Finally note what seems like an insane amount of backslashes in the update commands! That’s because we have to escape things first for Perl, but also for the shell that will ultimately execute those commands:

# Create the steps to run the actual tests, with some extra code to handle
# updating the historical timing data when the tests finish successfully.

foreach my $step (@steps) {

    my $updateCommand = <<"END_UPDATE_COMMAND";

if [ \$? = 0 ] ; then
    echo "Step succeeded, updating timing data."
    TIMING_PROPERTY="/myProject/systemtest/$step->{name}"
    LENGTH=`ectool getProperty /myJobStep/elapsedTime`
    OLD_LENGTH=`ectool getProperty "\$TIMING_PROPERTY" 2> /dev/null`
    if [ -z "\$OLD_LENGTH" ] ; then
        ectool createProperty "\$TIMING_PROPERTY" --suppressValueTracking 1
        NEW_LENGTH=\$(expr \$LENGTH / 1000)
    else
        NEW_LENGTH=\$(expr \\( \\( \$OLD_LENGTH \\* 4 \\) + \\( \$LENGTH / 1000 
\\) \\) / 5 )
    fi
    ectool setProperty "\$TIMING_PROPERTY" "\$NEW_LENGTH" --suppressValueTrackin
g 1
else
    echo "Step failed, skipping timing update."
fi
END_UPDATE_COMMAND

    $ec->createJobStep({
        jobStepId      => $ENV{COMMANDER_JOBSTEPID},
        jobStepName    => "$step->{label}",
        resourceName   => "systemtest-pool",
        parallel       => 1,
        command        => $step->{command} . $updateCommand,
        shell          => "sh",
        logFileName    => "systemtest-$step->{name}.log",
        postProcessor  => "postp",
        timeLimit      => "90",
        timeLimitUnits => 'minutes'
                       });
}

And that’s it! All that remains is to delete (or disable) the original manually created steps for running the tests and give our new mechanism a try. Note that on the first trial run the schedule order will not be optimized, because we haven’t yet populated the historical runtime data for the steps. You could bootstrap the process by manually creating the properties with that information, or you could just run the process twice — once to learn the step durations, and a second time to use that data to optimize the schedule. In the ZipGit CI process, applying schedule optimization to the system test steps cut the execution time from 90 minutes to about 64 minutes, a 29% improvement!

And as expected, when we graph the execution of these steps everything is neatly packed. With schedule optimization enabled, we make the most efficient possible use of the pool of resources:

Final thoughts

Schedule optimization is a powerful technique that allows you to squeeze the absolute best performance out of a resource constrained environment — and let’s be honest, what environment isn’t resource constrained? With minimal effort you can ensure ideal utilization of your resources, cutting both your wait time and your cost-per-build. CloudBees CD makes it easy, with durable storage in the form of properties and property sheets, and a powerful Perl API for dynamic step creation. I hope this has inspired you to try schedule optimization in your own CI processes!

What’s new in CloudBees Build Acceleration 12.0?

Just in time for the new year, this month we released CloudBees Build Acceleration 12.0, the 40th feature release of the product previously known as CloudBees Accelerator and before that ElectricAccelerator. This is possibly the most significant update for most end users since the 8.0 release in 2015, thanks to a massive overhaul and expansion of the Build Details page in the Cluster Manager that puts metrics, visualization and even recommendations just a click away in your browser. We also improved jobcache, by adding context-sensitive hashing for C/C++ source files — no more cache misses when you change comments! — as well as content-sensitive hashing for Unix archives, and support for caching Kotlin compilation. Finally, we added an enhancement to our GNU make emulation to automatically create output directories: no more need for messy order-only prereqs or sentinel files or mkdir -p $(dirname $@) all over your makefiles. Keep reading for screenshots and more details.

Build Details

The improvements I’m most excited about in Build Acceleration 12.0 are the sweeping updates to the Build Details page in the Cluster Manager. These are designed to give you access to build visualization and performance analysis, right from the comfort of the browser. Much of this functionality has been available for a long time as part of Insight, a desktop application for build visualization and analysis, but we found that few users took advantage of that functionality. We hope that by automatically collecting the data and providing it via the Cluster Manager web interface, more users will be able to leverage that analysis not only to see the benefit they derive from using Build Acceleration, but to better monitor and improve performance. The update consists of a redesigned UI framework for the Build Details page, as well as several new or enhanced sub-tabs:

  • The Settings tab shows both the user-specified options used in the build, as well as any other properties determined by emake itself, like the OS version and others.
  • The Environment tab shows the environment variables in effect when emake was invoked.
  • The Performance tab shows dozens of individual performance metrics, such as network and disk bandwidth and compression performance, as well as the number of agents in use over the duration of the build and the critical path through the build, or the serialized set of jobs that determines the minimum possible duration of the build.
  • The Jobcache tab shows metrics relating to the use of jobcache in the build, including the overall cache hit rate, the estimated time saved due to caching, and the specific types of jobcache used. You can also find the portion of the total build workload that was cached.
  • The Composition tab shows a breakdown of the work performed during the build according to the semantic classification of that work, such as compilation, linking, or packaging. Clicking on any of the categories shows the longest jobs in the build belonging to that category.
  • The Timeline tab shows a visualization of the build’s execution. For efficiency reasons (both in terms of rendering and backend storage) detailed information is only available for non-trivial jobs in the build. Shorter jobs are aggregated into blocks so they can still be seen in this visualization. If you want to see more details than are available in this visualization, you can run CloudBees Build Acceleration Insight on the annotation file from the build.
  • The Diagnostics tab presents warnings and error messages culled from the build output log, using analysis similar to that found in CloudBees CD (formerly ElectricFlow).
  • Finally, the Recommendations tab presents suggestions for ways to improve build performance and an estimate of the impact of implementing those suggestions. The list is prioritized according to that estimate. Of course this is not an exhaustive list of ways to improve performance — instead, you should see these recommendations as a starting point for build optimization. Today the report checks for several common types of performance gotchas; in the future we hope to add more.

If you’ve used Build Acceleration Insight in the past, some of the information you’ll find in the Build Details page now will seem familiar. The nice thing is that you no longer have to manually remember to run Insight, and you can access this analysis from any browser that can access the Cluster Manager, even for builds that were run on different hosts and for which the annotation file may not be available. I truly believe that having this information easily accessible will enable more users to “self serve” when it comes to performance analysis, effectively making everybody a Build Acceleration “super user”.

Note: in order to use the new Build Details, you must upgrade both the Cluster Manager and emake to 12.0 or later. Enhanced analysis is not available for builds run using older versions of emake.

Build Signature and Totality

Tucked into the Build Details screenshots above you may have noticed a couple additional fields in the header: signature and totality. These new build properties make it possible to identify builds that are building the same stuff, and whether a build is full or incremental:

The signature is simply a hash of the names of all the output targets in the build, in serial order. If you run the same build repeatedly, you should get the same signature for each run. If you add or remove modules or targets in the build, the signature will change. If the builds are entirely different, such as of different packages, the signatures will be different.

The totality of the build reflects the percentage of rule jobs in the build that were determined to be out-of-date during the run. In theory a full-from-scratch build will have a totality of 100%, although many builds have duplicate targets and other quirks that result in the totality being less than that even for a full-from-scratch build. Each build is unique, so you’ll have to observe the behavior of this value in your own builds to know what is normal for your configuration. Conversely, a “no touch” build should have a totality of 0%, but again many builds have rules that are always run, so even in a “no touch” build the totality is not quite 0%. Again, you’ll have to observe the behavior in your builds to understand what is normal for your configuration. In general comparing totality from dissimilar builds (that is, those that have a different signature) is not useful, but you can use it to distinguish full (or mostly full) builds from incremental or no touch builds when the signatures are the same. Remember too that totality is a continuum: if 100% is a full-from-scratch build and 0% is a no touch build, an incremental that rebuilds only a few outputs might have a totality of 10% or 20%, while an incremental that rebuilds many outputs might have a totality of 70% or 80%.

JobCache Enhancements

CloudBees Build Acceleration 12.0 also includes several improvements to the jobcache feature to improve performance, increase cache hit rates and expand the types of work that can be cached. Chief among these is an intelligent hasher for C/C++ source code, which enables emake to ignore comments and blank lines in those files when determining whether an input has changed. That means that these two fragments are considered equivalent:

/* Generated 2020-DEC-15 11:57:32 */
#include "util.h"
static const int DEBUG = 1;
/* Generated 2020-DEC-18 15:12:47 */
#include "util.h"
static const int DEBUG = 1;

Previously a change like this would have caused a jobcache miss — technically correct, but unfortunate since obviously the code in question has not actually changed in a meaningful way. With this enhancement, emake correctly recognizes that fact, and you’ll get a jobcache hit (assuming no other changes, of course).

Along the same lines, we added an intelligent hasher for Unix archive files — .a or .la files. In this case, emake now knows to ignore the timestamps embedded in the archive, while still considering the content of the members of the archive. Again this allows for a greater number of cache hits in practical usage.

Next, we extended the javac jobcache type so it applies to Kotlin compilation in addition to Java compilation. Kotlin is a programming language that is used extensively in the Android ecosystem, and which is interoperable with Java — in fact in most cases Kotlin is compiled into Java byte code. Expanding the scope of jobcache to include Kotlin enables caching of even more work in Android system builds.

Finally, in this release we changed how emake stores timestamp data in jobcache entries. Previously, if a cached job set an explicit timestamp on a file (something like touch -t 202012010000 foo), that timestamp would be recreated precisely as it was saved in the cache, even if the cache was used days or months after it was originally initialized. That lead to some surprising behaviors, because running a build today might result in build outputs with a timestamp from some time far in the past. In turn that caused unwanted rework in incremental builds, because some timestamps were very old, but others (from outputs created by uncached jobs, for example) were current. With this change, emake no longer saves explicit timestamp modifications in the jobcache, so outputs pulled from the cache are always given a timestamp reflecting the time at which the outputs were created in the current build.

Automatically creating output directories

Although there are many other improvements in the 12.0 release, there’s one more in particular that I think warrants a mention, because it directly addresses a problem that many make users contend with: how to efficiently, succinctly, and correctly create parent directories for output targets in the build. This is a topic that has been written about often and which should be familiar to anybody who’s had to maintain a make-based build. Essentially the question is: how can we make sure the directories for outputs in a makefile will be created before the outputs themselves are created? Of course if you fail to create the directories, the build will fail. It’s true there are a variety of ways to solve this in GNU make, but truthfully they are all kind of clunky, requiring some combination of redundant mkdir commands (which waste time), or sentry files (which create clutter), or for the user to remember to add extra prereqs all over the place. Other build tools, like ninja, have a pretty tidy solution: the build tool itself just automatically creates the output directory just before it is needed. This is clean, simple, and efficient — and now, if you use emake, you can get the same behavior for your make-based build by adding --emake-create-output-dirs=1 to your invocation. In this mode, emake will automatically create special jobs to handle making output directories in the most efficient possible way, with no makefile modifications required.

Availability

As you can see, I’m pretty excited about the 12.0 release of CloudBees Build Acceleration. I can’t wait to see how people make use of the new Build Details information to understand and optimize their builds, and I’m always amazed that even after 40 releases we’re still finding ways to make builds faster than ever. I hope you’ll upgrade soon.

CloudBees Build Acceleration 12.0 is available immediately for current users, and new users can download a free trial.

Top posts for December 2010

The following articles generated the most traffic in November. Unfortunately I don’t have stats for my articles on the Electric Cloud Blog this month, but here’s the data for the top five posts on blog.melski.net:

  1. Makefile hacks: print the value of any variable: 89% of page views
  2. Shell commands in GNU make: 4% of page views
  3. HOWTO: install kernel debuginfo packages on SUSE Linux Enterprise Server 11: 2% of page views
  4. Cloud computing for traditional dev/test: 1% of page views
  5. Public versus private clouds for dev/test: 1% of page views

The top article, Makefile hacks: print the value of any variable was wildly popular, which is great, but also skewed the numbers pretty heavily. The price of (small) success, I suppose.