The inverted parallel build bug

At some point most of you have encountered “the” parallel build problem: a build that works just fine when run serially, but breaks sometimes when run in parallel. You may have read my blog about how ElectricAccelerator automatically solves the classic parallel build problem. Recently I ran into the opposite problem in a customer’s build: a build that “works” when run in parallel, but breaks when run serially! If you’re lucky, this build defect will just cause occasional build failures. If you’re unlucky, it will silently corrupt your build output at random. With traditional GNU make this nasty bug is a nightmare to track down — if you even know that its present!

In contrast, the unique features in ElectricAccelerator make it trivial to find the defect — some might even say it’s fun (well, if you’re like me and you enjoy using powerful tools to do sophisticated analysis without breaking a sweat!). Read on to see how ElectricAccelerator makes it easy to diagnose and fix bugs in your build.

The inverted parallel build bug

Let’s start with a concrete example. Here’s a simple Makefile which (appears to) work when run in parallel, but which consistently fails serially:

1
2
3
4
5
6
7
8
all: reader writer
reader:
sleep 2
cat output
writer:
echo PASS > output

Assuming that output does not exist, executing this makefile serially will always produce an error:

$ gmake
sleep 2
cat output
cat: output: No such file or directory
gmake: *** [reader] Error 1

But if you execute this makefile in parallel, it appears to work!:

$ gmake -j 2
sleep 2
echo PASS > output
cat output
PASS

If we visualize the execution of these commands it’s easy to see why the parallel build seems to work:

Sample parallel execution timeline

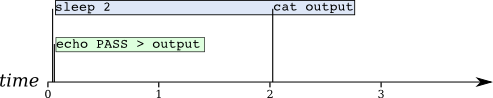
At the beginning of the build, both reader and writer are started, more-or-less at the same time, because we told gmake to run two jobs at a time. reader has two commands, which are executed serially according to the semantics of make. While the sleep 2 is executing, the echo command in writer runs and completes. When the cat command in reader starts, it succeeds because output is ready-to-go.

Parallel execution is no guarantee

Some people will look at that explanation and think “Got it — always run this thing in parallel and we’re good!” Of course, you can’t really be 100% sure that everybody will remember to run the makefile in parallel. But even if you could, there’s a flaw in that reasoning: basically, your build has a race condition, and there’s no guarantee that you’ll “win” the race every time. For example, if your build server is heavily loaded, the sequence of events might look like this instead:

Alternative parallel execution timeline

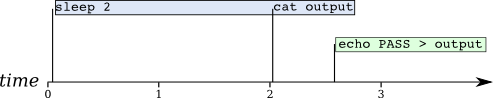
Here, writer doesn’t get started until after the sleep command has finished — too late to save the cat command from failure.

Build failure is not the worst outcome

Before we move on to finding and fixing problems like this, let’s take a quick look at one more failure mode: incremental builds. In particular, check out what happens if output exists before the build starts, but with incorrect content (for example, stale data from an earlier build):

$ echo '*** FAIL ***' > output
$ gmake
sleep 2
cat output
*** FAIL ***
echo PASS > output
$ echo $?
0

That’s right — the build “succeeded”, because it produced no error messages and exited with a zero exit code. And yet, it produced completely bogus output. Ouch!

Somebody save me!

If you’re using ordinary GNU make, you’re in for a world of hurt with a problem like this. First, the only way to consistently reproduce the problem is to run the entire build serially — of course that probably takes a long time, or you wouldn’t have been using parallel builds in the first place. Second, there are no diagnostics built into gmake that could help you identify which job produces output. One option is to use strace to monitor filesystem accesses, but that will generate a mountain of data in a not-very-usable format. Plus, it imposes a substantial performance penalty — on top of the hit you’d already take for running the build serially. Yuck!

If you’re using Electric Make, this problem is embarrassingly easy to solve thanks to emake’s core features:

  • Consistent results: emake mimics serial execution with gmake, so you’ll always get a consistent result with this build. That means it will fail, the same way, every time, which means you’ll discover the problem immediately after it is introduced, not months or years later after it has become nearly impossible to tell which Makefile change introduced the defect.
  • Parallel speed: emake’s results match those of a serial gmake build, but its performance is more like that of a parallel gmake build — better, in most cases.
  • Annotated build logs: emake can generate an XML-enhanced version of the build output log which contains a record of every file accessed by every job in the build. This annotation file can easily be mined to identify pairs of jobs where the reader preceeds the writer.

You can use any general purpose XML parsing library to read annotation files, but it’s easy to use annolib, the high-performance annotation processing library we wrote to facilitate this kind of analysis. Since annolib is built into ElectricInsight, the easiest way to use it is to write the analysis as a custom Insight report. All you need to do is iterate through the files referenced in the build, looking for read operations (or, in this case, failed lookups) preceeding a write operation. Here’s the code:

global anno
set instances [list]

# Iterate over the files referenced in the build...

foreach filename [$anno files] {
    set readers [list]

    # Iterate over the operations performed on the file...

    foreach tuple [$anno file operations $filename] {
        foreach {job op dummy} $tuple { break }
        if { $op == "read" || $op == "failedlookup" } {
            # If this is a read operation, note the job that did the read.

            lappend readers $job
        } elseif {$op == "create" || $op == "modify" || $op == "truncate"} {
            # If this is a write operation but earlier jobs already read
            # the file, we've found a read-before-write instance.

            if { [llength $readers] } {
                lappend instances [list $readers $job $filename]
            }

            # After we see a write on this file we can move on to the next.

            break
        }
    }
}

# For each instance, print the filename, the writer, and each reader.

set result ""
foreach instance $instances {
    foreach {readers writer filename} $instance { break }
    set writerName [$anno job name $writer]
    set writerFile [$anno job makefile $writer]
    set writerLine [$anno job line $writer]
    append result "FILENAME:\n  $filename\n"
    append result "WRITER  :\n  $writerName ($writerFile:$writerLine)\n"
    append result "READERS :\n"
    foreach reader $readers {
        set readerName [$anno job name $reader]
        set readerFile [$anno job makefile $reader]
        set readerLine [$anno job line $reader]
        append result "  $readerName ($readerFile:$readerLine)\n"
    }
}

With a bit of additional boilerplate you can run this report from the command-line with Insight 4.0 (currently in limited beta). A couple notes on usage: you should instruct emake to generate lookup-level annotation, by adding –emake-annodetail=lookup to your invocation. And, you should run the build with the -k (keep-going) option — otherwise, the error in reader will prevent writer from running, and emake will not record filesystem usage for it. Once you have a suitable annotation file, here’s how the report looks for this build:

$ einsight --report=ReadBeforeWrite emake.xml
done.
FILENAME:
/home/ericm/test/output
WRITER :
writer (Makefile:7)
READERS :
reader (Makefile:3)

Voila! We’ve pinpointed the problem with barely 50 lines of code (including comments!). You can even see a solution: add writer as a prerequisite of reader, on line 3 of Makefile.

Show me what you can do with ElectricAccelerator

As you’ve seen, ElectricAccelerator makes it easy to identify and correct build problems that would otherwise be nearly impossible to root out. Hopefully you also see that this is just the tip of the iceberg — with consistent fast builds and the treasure trove of data available in annotation files, what other analysis could you do? To get started, you can download a free trial of ElectricAccelerator Developer Edition and check out the reports in ElectricInsight. You can also download the Read Before Write report for ElectricInsight from my GitHub repo. If you come up with something cool, tell me about it in the comments!

try_eade_button2

ElectricMake debug log levels

Often when analyzing builds executed with ElectricMake, all the information you need is in the annotation file — an easily digested XML file containing data such as the relationships between the jobs, the commands run, and the timing of each job. But sometimes you need more detail, and that’s where the emake debug log comes in.

To enable emake debug logging, you specify a pair of command-line arguments: ––emake-debug=value, which specifies the types of debug logging to enable as a set of single-letter values, such as “jng”; and ––emake-logfile=path, which specifies the location of the debug log. In this article I’ll explain each of emake’s debug log levels. Use this index to jump to the definition of a specific log level:

DISCLAIMER: emake debug logs are intended for use by Electric Cloud engineering and support staff. Debug logging contents and availability are subject to change in any release, for any or no reason. Enter at your own risk, your mileage may vary, etc. etc. The information in this article refers to ElectricAccelerator 6.0.

a: agent allocation

Agent allocation logging provides detailed information about emake’s attempts to procure agents from the cluster manager during the build. If you think emake may be stalled trying to acquire agents, allocation logging will help to understand what’s happening.

c: cache

Cache logging records details about the filesystem cache used by emake to accelerate parse jobs in cluster builds. For example, it logs when a directory’s contents are added to the cache, and the result of lookups in the cache. Since it is only used during remote parse jobs, you’ll have to use it with the ––emake-rdebug=value option. Use cache logging if you suspect a problem with the cached local filesystem.

e: environment

Environment logging augments node logging with a dump of the entire environment block for every job as it is sent to an agent. Normally this is omitted because it’s quite verbose (could be as much as 32KB per job). Usually you’re better off using env-level annotation, which is more compact and easier to parse.

f: filesystem

Filesystem logging records numerous details about emake’s interaction with its versioned filesystem data structure. In particular, it logs every time that emake looks up a file (when doing up-to-date checks, for example), and it logs every update to the versioned file system caused by file usage during the build’s execution. This level of logging is very verbose, so you shouldn’t enable it as a general rule. It’s most often used when diagnosing issues related to the versioned filesystem and conflicts.

g: profiling

Profiling logging is one of the easiest to interpret and most useful types of debug logging. When enabled, emake will emit hundreds of performance metrics at the end of the build. This is a very lightweight logging level, and is safe (even advisable) to enable for all builds.

h: history

History logging prints messages related to the data tracked in the emake history file — both filesystem dependencies and autodep information. When history logging is enabled, emake will print a message every time a dependency is added to the history file, and it will print information about the files checked during up-to-date checks based on autodep data. Enable history logging if you suspect a problem with autodep behavior.

j: job

Job logging prints minimal messages related to the creation and execution of jobs. For each job you’ll see a message when it starts running, when it finishes running, and when emake checks the job for conflicts. If there is a conflict in the job, you’ll see a message about that too. If you just want a general overview of how the build is progressing, j-level logging is a good choice.

L: nmake lexer

emake uses a generated parser to process portions of nmake makefiles. Lexer debug logging enables the debug logging in that generated code. This is generally not useful to end users as it is too low-level.

l: ledger

Ledger debug logging prints information about build decisions based on data in the ledger file, as well as updates made to the ledger file. Enable it if you believe the ledger is not functioning correctly.

m: memory

When memory logging is enabled, emake will print memory usage metrics to the debug log once per second. This includes the total process memory usage as well as current and peak memory usage grouped into several “buckets” corresponding to various types of data in emake. For example, the “Operation” bucket indicates the amount of memory used to store file operations; the “Variable” bucket is the amount of memory used for makefile variables. This is most useful when you are experiencing an out-of-memory failure in emake, as it can provide guidance as to how memory is being utilitized during the build, and how quickly it is growing.

n: node

Node logging prints detailed information about all messages between emake and the agents, including filesystem data and commands executed. Together with job logging, this can give a very comprehensive picture of the behavior of a build. However, node logging is extremely verbose, so you should enable it only when you are chasing a specific problem.

o: parse output

When parse output logging is enabled, emake will preserve the raw result of parsing a makefile. The result is a binary file containing information about all the targets, rules, dependencies and variables extracted from makefiles read during a parse job. This can be useful when investigating parser incompatibility issues and scheduling issues (for example, if a rule is not being scheduled for execution when you expect). Note that this debug level only makes sense when parsing, which means you have to specify it in the ––emake-rdebug option. The parse results will be saved in the ––emake-rlogdir directory, named as parse_jobid.out. Note that the directory may be on the local disk of the remote nodes, depending on the value you specify!

p: parse

Parse debug logging prints extremely detailed information about the reading and interpretation of makefiles during a parse job. This is most useful when investigating parser compatibility issues. This output is very verbose, so you should only enable this when pursuing a specific problem. Note that like parse output logging, this debug level only makes sense during parsing, which means you have to specify it in the ––emake-rdebug option. The parse log files will be saved in the ––emake-rlogdir directory, named as parse_jobid.dlog. Note that the directory may be on the local disk of the remote nodes, depending on the value you specify!

r: parse relocation

Parse relocation logging prints low-level information about the process of transmitting parse result data to emake at the end of a parse job. It’s only used internally when we are extending the parse result format, and so is unlikely to be of interest to end users.

s: subbuild

Subbuild logging prints details about decisions made while using the emake subbuild feature. You should enable it if you believe that the subbuild feature is not working correctly.

Y: authentication

Authentication logging is a subset of node logging that prints only those messages related to authenticating emake to agents and vice-versa. If you are having problems using the authentication feature, you should enable this debug level.

HOWTO: diagnose build failures with ElectricMake and ElectricInsight

The other day a colleague asked for my help determining the cause of a broken build. When run with ElectricMake, the build consistently failed with this error:

Error: Could not open include file "api.h".
make: *** [js/src/jsreflect.o] Error 1

Diagnosing problems like this is similar to investigation in any scientific field: form a hypothesis, devise an experiment to test it, and use the results of the experiment to refine the hypothesis; then repeat until you can explain the observed behavior. In this case I didn’t have access to the build environment so I couldn’t run builds myself, which limited my ability to experiment somewhat. Instead, I had to rely on the data my colleague provided: an emake annofile from the build, with lookup-level logging. If you can only get one build artifact for debugging, that’s a pretty good choice.

Hypothesis: api.h does not exist

The first thing to check is whether the file api.h exists at all. If it doesn’t, that would explain the failure. Of course, I had been told that this build works with gmake, so this is a pretty flimsy hypothesis — but it pays to be thorough.

One way to test this theory is to check the usage reported on the file. If the only usage is failed lookups, then the file never existed. If you see other usage, like reads or modifications to the file, that invalidates this hypothesis. We can use grep to search the annotation for usage on the file:

The file is clearly created during the build, so this theory is BUSTED.

Hypothesis: the writer job comes after the reader job

Since the file is created during the build, perhaps the problem is that the job that created it occurs later in the build than the job that needs it. That could happen if the makefile was set up incorrectly, for example. Like the previous theory, this one is on shaky ground because the build allegedly works with gmake. It’s easy to test though: find the job that created the file, and the job that reported the error, then compare their serial order — the order in which they would have run if the build were executed serially. If the writer has a later serial order, then the hypothesis is confirmed. Otherwise, the hypothesis is invalidated.

To find the writer job, I use less to search for the create operation referencing that file:

Then I search backwards for the containing <job> tag to determine which job created the file:

Now we know the file was created by job J003286c8. The easiest way to find the job’s serial order is to load the annotation in ElectricInsight, then bring up the Job Details window for the job (use Tools -> Find job by ID and enter the job to go directly to the Job Details):

To find the job that reported the error, search for failed jobs in ElectricInsight. That leads us to job J0032a168:

The writer has an lower serial order than the reader, meaning the writer comes first. Therefore this theory is also BUSTED.

Hypothesis: the reader job ran before the writer job finished

Since the writer precedes the reader in serial order, perhaps the problem is that the jobs were executed in the wrong order. We can test this hypothesis by checking the start and end time of each job, again by looking at the Job Details in ElectricInsight. Here’s the writer:

And the reader:

The jobs were actually running at the same time so this hypothesis is CONFIRMED.

Now we know why the reader failed to find the file: it ran before the writer finished, so naturally the file was not available. But this raises an entirely new and more perplexing question: this is precisely the type of dependency problem that ElectricMake is supposed to prevent, so why didn’t it work this time?

Hypothesis: conflict detection is completely broken

If everything is working correctly, emake ought to have detected a conflict in the reader job, discarded the bogus result, and rerun the job after the writer finished. A bug in emake’s conflict detection system could explain why emake failed to detect the dependency between the jobs and rerun the reader. We could construct any number of elaborate tests to try to prove that conflict detection is broken, but before we disappear down that rabbit hole, we should check the file usage recorded in the reader job. If we find usage that should have caused a conflict with the writer job, then we can continue with this line of investigation. But if there is no such usage, then we can reject this theory.

For an overview of conflict detection, read “How ElectricMake guarantees reliable parallel builds”. Briefly, in order for conflict detection to work there must be usage in the reader that references api.h. That’s how emake knows that the reader tried to use the file. When emake checks for conflicts, it will see that usage, and realize that the job accessed the wrong version of the file based on the serial order of the job. At minimum we should see a lookup operation recorded on the file.

We can find the file usage for the reader on the Annotation tab of the Job Details for the job in ElectricInsight. You can use CTRL-F to search for occurances of the string api.h in the job annotation. But in this case, there’s only one, in the error message text. There’s no usage recorded for the file, lookup or otherwise:

So this theory is clearly BUSTED. There was no conflict because there was no usage on the file in the reader job. But again, this result raises a new question: why is there no usage referencing api.h?

Hypothesis: there was a problem accessing the parent directory

A problem accessing the parent directory would explain why there is no usage for api.h. After all, you can’t lookup a file in a directory if you can’t access the directory itself. To verify this theory we have to check for usage on the parent directory, of course. If there is none, then we can consider the theory confirmed, and we will have to come up with an explanation for that failure. But if there is usage on the parent directory, we can reject this theory. Specifically, we ought to see a lookup recorded for the parent directory, captured as a side effect of the compiler accessing files in the directory.

So we turn again to the Annotation tab of the Job Details for the reader job in ElectricInsight. This time we’ll search for the string build/view/src, which turns up just one match:

There is usage recorded for the parent directory, so this theory is BUSTED.

But there’s a surprise lurking in the result: instead of a lookup, we see a read recorded on the directory. Why is that surprising? Consider what a compiler does: read the source file, locate and read include files, and write the output file. Nothing in that description requires reading directories. This leads us to a new hypothesis, which explains both the peculiar usage and the build failure.

Hypothesis: the compiler caches directory listings to avoid system calls

The simplest way to search for include files is to stat() the file in each directory given in the include path. If the stat() succeeds, you’ve found the file; if not, try the next directory.

This is simple, but inefficient if you have many directories in your include path. Suppose you have 300 directories, and 10 include files. On average you’ll check half of the directories before finding each file, for a total of 1,500 stat() calls! As everybody “knows”, system calls are slow, so some clever compilers use a different strategy: cache the listing of each directory in a hash table, then consult this cache, rather than using stat(). With 300 directories, you can do a few hundred getdents() system calls, instead of thousands of stat() calls. Brilliant!

There’s just one problem: this trick conceals from emake the fact that the job tried to find api.h. Since the lookup never hit the filesystem, emake has no record of it, and therefore cannot detect the conflict.

Sidebar: directory read conflicts

Of course, emake can still detect the conflict — by comparing the contents of the directory as they were with the contents as they should have been. That is, emake can tell that the reader job got a particular set of filenames for the directory listing, and that the set would have been different if the reader had run at the correct time — it would have included api.h.

This is an example of a directory read conflict. The important thing to know is that emake deliberately ignores these conflicts. If it didn’t, many builds would be horribly over-serialized — usually when programs read directories during a build, they don’t actually care about the entire directory listing. If emake strictly honored directory read conflicts, a job that read a directory would be serialized against every job that created or deleted any file in that directory. Nobody wants that.

Fortunately, there’s a solution: once the compiler has found the include file, it goes on to read it, of course. The read gets recorded in the job’s file usage, and that gives emake enough information to properly serialize the reader and the writer. So we need only to ensure that the filesystem state is correct when the reader runs, for a single run of the build. After that, emake will record the dependency in its history file, which will ensure correct behavior in subsequent builds. One easy way to do this is to run a single-agent build, using –emake-maxagents=1. That forces each job to run serially. This mode is how we will test our final hypothesis. If we’re correct, then the build will succeed; if not, the build will still fail.

Epilogue

As I stated, I didn’t have access to this build myself, so I had to wait for the user to test this hypothesis. When they did, they found that the single-agent build succeeded, and by checking the file usage for the reader job in the new build, we can see a read of api.h, as expected. Our final theory is CONFIRMED: the build failed because the compiler caches directory listings instead of doing direct filesystem lookups for include files, and emake intentionally ignores directory read conflicts.

The simplest solution to the problem is to generate a good history file by running emake with –emake-maxagents=1, but you could also add an explicit dependency between the jobs in the makefile; or you could wait for ElectricAccelerator 6.0, which will include a feature that allows you to explicitly enable directory read conflicts with a command-line option.

Makefile hacks: print the value of any variable

One of my favorite makefile debugging tricks is this rule for printing out the value of a variable:

print-%:
        @echo '$*=$($*)'

Throw this into a GNU make makefile and then print any make variable you like by invoking targets like print-MAKE_VERSION:

ericm@chester:/tmp$ gmake print-MAKE_VERSION
MAKE_VERSION=3.81

You can imagine how handy this is when diagnosing issues with your makefiles. Here’s how it works:

  1. print-% defines a pattern rule that matches any target that starts with the characters print-.
  2. In the context of a pattern rule, the $* variable expands to the stem of the target, that part which matched the % in the pattern. In my example above, that corresponds to MAKE_VERSION.
  3. GNU make variable expansion rules allow for variable references inside variable names, so $($*) expands first to $(MAKE_VERSION), and finally to the value of the MAKE_VERSION variable.

Makefile injection with -f

The print-% rule is a slick hack, but it’s a nuisance to have to modify a makefile just to use it. Worse, you might not even be able to modify the makefile. Fortunately, there’s a solution: the -f command-line option. You’re probably familiar with it — that’s how you tell gmake to use a different makefile than the default Makefile when it starts. For example, if you have a makefile named build.mak:

gmake -f build.mak

What you may not know is that you can use multiple -f options on the command line. GNU make will read each file in turn, incorporating the contents of each just as if they were included with the include directive. We can create a simple makefile called printvar.mak containing nothing but our print-% rule, then inject it into any makefile we want like this:

gmake -f printvar.mak -f Makefile print-MAKE_VERSION

A shell script to save typing

The combination of the print-% rule and the -f command-line option is powerful, but it’s unwieldy — too many characters to type. The solution is a shell script wrapper:

#!/bin/bash

filename=""
if [ -f GNUmakefile ] ; then
  filename="GNUmakefile"
elif [ -f makefile ] ; then
  filename="makefile"
elif [ -f Makefile ] ; then
  filename="Makefile"
fi
if [ -n "$filename" ] ; then
  vars=""
  for n in $@ ; do
    vars="$vars print-$n"
  done
  gmake -f $filename -f printvar.mak $vars
else
  echo "No makefile found" 1>&2
  exit 1
fi

Save that in a file called printvars somewhere on your PATH and you can do things like this:

ericm@chester:/tmp$ printvars MAKE_VERSION COMPILE.cc
MAKE_VERSION=3.81
COMPILE.cc=g++    -c

Advanced make variable diagnostics

Beyond simply printing the value of a variable, GNU make 3.81 has three built-in functions that allow introspection on variables, which you can add to the print-% rule for additional diagnostics.

First is the $(origin) function, which tells you how a variable was defined. For example, if a variable FOO was inherited from the environment, $(origin FOO) will give the result environment. Variables defined in a makefile will give the result file, and so forth.

Next is the $(flavor) function, which tells you the flavor of the variable, either simple or recursive.

Finally is the $(value) function, which gives you the unexpanded value of the variable. For example, if you have variables like this:

FOO=123
BAR=$(FOO)

$(value BAR) will give the result $(FOO), rather than the fully-expanded 123 that you might expect.

With these additions, the print-% rule now looks like this:

print-%:
	@echo '$*=$($*)'
	@echo '  origin = $(origin $*)'
	@echo '  flavor = $(flavor $*)'
	@echo '   value = $(value  $*)'

And here’s how it looks in action:

ericm@chester:/tmp$ printvars MAKE_VERSION COMPILE.cc
MAKE_VERSION=3.81
  origin = default
  flavor = simple
   value = 3.81
COMPILE.cc=g++    -c
  origin = default
  flavor = recursive
   value = $(CXX) $(CXXFLAGS) $(CPPFLAGS) $(TARGET_ARCH) -c