Bash completion for ElectricAccelerator

Maybe you haven’t noticed, but Electric Make (emake) has a lot of command-line options. Besides the options it inherits from emulating GNU make (or NMAKE), it has about fifty of its own options, from –emake-annodetail to –emake-tmpdir. Remembering them all, and their exact spelling, and their allowed values is a nuisance, even for me — and I created half of those options myself. So, I spent the last few evenings hacking together Bash TAB completion support for emake (download from github here), with pretty good results:

$ emake --emake-h<TAB><TAB>
--emake-history=        --emake-historyfile=  
--emake-history-force=

In addition to helping with emake options, it can help me remember the valid values for those options:

$ emake --emake-history=<TAB><TAB>
create  merge  read

It handles options with compounds values too, like –emake-annodetail:

$ emake --emake-annodetail=<TAB><TAB>
basic  env  file  history  lookup  registry  waiting
$ emake --emake-annodetail=file,<TAB><TAB>
file,basic     file,history   file,registry  
file,env       file,lookup    file,waiting   
$ emake --emake-annodetail=file,history,<TAB><TAB>
file,history,basic     file,history,registry
file,history,env       file,history,waiting
file,history,lookup    

It can even do TAB completion on targets in makefiles, thanks to some clever code inherited from the gmake completion module that I used as the basis for my emake completion module:

$ emake <TAB><TAB>
all        check      distclean  Makefile   
buildtest  clean      install    

And since I was already tinkering with TAB completion for emake, it wasn’t much work to do TAB completion for ElectricInsight (einsight) as well. In that case, TAB completion doesn’t really do a whole lot — einsight doesn’t have many command-line options. But intelligent TAB completion is still pretty handy for one specific reason: I can make it only match files with the correct extension — .xml and .anno:

$ ls
build-272.dlog  build-272.xml
build-273.dlog  build-273.xml
$ einsight <TAB>
$ einsight build-27<TAB><TAB>
build-272.xml  build-273.xml  

Rather than suggesting all of the files in the directory, Bash now knows to suggest only the .xml files when I invoke einsight.

I was surprised to find that setting up custom TAB completion for my applications is pretty easy: just create a shell function that generates a list of possible completions based on a partial command-line, then instruct the shell to use that function to handle completions for whatever command you like. As far as I can tell, the mechanism is pretty flexible — you’re limited only by your own Bash scripting skill. If you’re interested in doing something like this yourself, I suggest you check out these online tutorials, as well as the Bash Completion project, which includes completion modules for nearly 200 commands.

Availability and installation

You can download the TAB completion module for emake and einsight from my github repository. As far as installation goes, you have a few options:

  1. Hook into the bash-completion package. Many modern Linux distributions, including Ubuntu 9.x/10.x and SUSE 11 install the bash-completion package and set up the default bashrc file to use it. On those systems, you can just copy accelerator.sh to /etc/bash_completion.d.
  2. Modify your personal .bashrc. If your system doesn’t have the bash-completion package, or if you can’t add files to etc, you can modify your own .bashrc to source accelerator.sh on startup. In that case I would rename it to $(HOME)/.accelerator.sh, so that it is normally hidden from directory listings, and add source $(HOME)/.accelerator.sh to your .bashrc file.

The image at the top of this post is free; you can redestribute it and/or modify it according to the terms of the Free Art License; it is based on this image by Aurelio Heckert.

Makefile hacks: print the value of any variable

One of my favorite makefile debugging tricks is this rule for printing out the value of a variable:

print-%:
        @echo '$*=$($*)'

Throw this into a GNU make makefile and then print any make variable you like by invoking targets like print-MAKE_VERSION:

ericm@chester:/tmp$ gmake print-MAKE_VERSION
MAKE_VERSION=3.81

You can imagine how handy this is when diagnosing issues with your makefiles. Here’s how it works:

  1. print-% defines a pattern rule that matches any target that starts with the characters print-.
  2. In the context of a pattern rule, the $* variable expands to the stem of the target, that part which matched the % in the pattern. In my example above, that corresponds to MAKE_VERSION.
  3. GNU make variable expansion rules allow for variable references inside variable names, so $($*) expands first to $(MAKE_VERSION), and finally to the value of the MAKE_VERSION variable.

Makefile injection with -f

The print-% rule is a slick hack, but it’s a nuisance to have to modify a makefile just to use it. Worse, you might not even be able to modify the makefile. Fortunately, there’s a solution: the -f command-line option. You’re probably familiar with it — that’s how you tell gmake to use a different makefile than the default Makefile when it starts. For example, if you have a makefile named build.mak:

gmake -f build.mak

What you may not know is that you can use multiple -f options on the command line. GNU make will read each file in turn, incorporating the contents of each just as if they were included with the include directive. We can create a simple makefile called printvar.mak containing nothing but our print-% rule, then inject it into any makefile we want like this:

gmake -f printvar.mak -f Makefile print-MAKE_VERSION

A shell script to save typing

The combination of the print-% rule and the -f command-line option is powerful, but it’s unwieldy — too many characters to type. The solution is a shell script wrapper:

#!/bin/bash

filename=""
if [ -f GNUmakefile ] ; then
  filename="GNUmakefile"
elif [ -f makefile ] ; then
  filename="makefile"
elif [ -f Makefile ] ; then
  filename="Makefile"
fi
if [ -n "$filename" ] ; then
  vars=""
  for n in $@ ; do
    vars="$vars print-$n"
  done
  gmake -f $filename -f printvar.mak $vars
else
  echo "No makefile found" 1>&2
  exit 1
fi

Save that in a file called printvars somewhere on your PATH and you can do things like this:

ericm@chester:/tmp$ printvars MAKE_VERSION COMPILE.cc
MAKE_VERSION=3.81
COMPILE.cc=g++    -c

Advanced make variable diagnostics

Beyond simply printing the value of a variable, GNU make 3.81 has three built-in functions that allow introspection on variables, which you can add to the print-% rule for additional diagnostics.

First is the $(origin) function, which tells you how a variable was defined. For example, if a variable FOO was inherited from the environment, $(origin FOO) will give the result environment. Variables defined in a makefile will give the result file, and so forth.

Next is the $(flavor) function, which tells you the flavor of the variable, either simple or recursive.

Finally is the $(value) function, which gives you the unexpanded value of the variable. For example, if you have variables like this:

FOO=123
BAR=$(FOO)

$(value BAR) will give the result $(FOO), rather than the fully-expanded 123 that you might expect.

With these additions, the print-% rule now looks like this:

print-%:
	@echo '$*=$($*)'
	@echo '  origin = $(origin $*)'
	@echo '  flavor = $(flavor $*)'
	@echo '   value = $(value  $*)'

And here’s how it looks in action:

ericm@chester:/tmp$ printvars MAKE_VERSION COMPILE.cc
MAKE_VERSION=3.81
  origin = default
  flavor = simple
   value = 3.81
COMPILE.cc=g++    -c
  origin = default
  flavor = recursive
   value = $(CXX) $(CXXFLAGS) $(CPPFLAGS) $(TARGET_ARCH) -c

Make syntax is the worst… except for all the alternatives

My series of comparisons between SCons and GNU make sparked a lot of discussion, not just about SCons and gmake, but about many other build tools. That was to expected, but what surprised me was several comments specifically criticizing the syntax of make — the semicolons, colons, ats and dollars that we all know so well. One reader actually said that make syntax has a 1970’s feel, as if the age of the language is somehow an indicator of unsuitability for the task. Then my friend John Graham-Cumming posted an article in defense of make syntax, and I figured I would add my thoughts.

Make syntax is the worst… except for all the alternatives

Criticisms of make syntax strike me as a bit absurd. Take a look around the build tool space: you’ll see that many of these “improved” tools use syntax that ranges from “pretty much the same” to “ridiculously verbose”. Let’s look at the syntax used for the two core functions of a build system: specifying the graph of depdencies between files, and specifying the commands to generate a file from a set of inputs.

Dependency graph syntax

The syntax for describing the relationship between input and output files in make is concise, if oblique:

foo: foo.in

To me this is elegant in its simplicity. You may argue that the choice of a colon is arbitrary, and you’d be right — but then, what would be significantly better? I would say there is nothing that is better, but plenty of things worse. For comparison, look at the same relationship, expressed in the syntax of some other build tools:

CMake
add_custom_command(
    OUTPUT foo
    COMMAND update -o foo foo.in
    DEPENDS foo.in)
Cook
foo: foo.in ;
Jam
MyCompile foo : foo.in ;
Rake
file foo => [ 'foo.in' ]
SCons
env.MyCompile('foo', 'foo.in')
tup
foo.in |> update -o %o %f |> foo
Waf
bld(
    rule     = 'update -o ${TGT} ${SRC}
    source   = 'foo.in',
    target   = 'foo')

Some of these, like Cook and Jam, are nearly identical to make. Others, like Waf, are certainly more verbose, but not obviously better. That verbosity may seem great when there’s only a handful of targets, but with hundreds of targets, it will be an irritation.

The truth is that there just isn’t any particular syntax that naturally lends itself to expressing a dependency graph. The reason make syntax hasn’t changed in over 30 years is because target: prereq works, and it’s just as good as anything else you might choose.

Command syntax

True to form, the syntax for specifying the commands to run to generate a file in make is just as terse:

update -o $@ $^

This minimalist syntax naturally puts the emphasis on the important stuff: the command to run and its flags. Here’s the same command in some other build tools (nota bene: some of these are the same as what’s shown above; in those cases I could not easily determine a syntax for specifying dependencies separately from commands, or whether that is even possible with that tool):

CMake
add_custom_command (
  OUTPUT foo
  COMMAND update -o foo foo.in
  DEPENDS foo.in
)
Cook
{
     update -o [target] [need];
}
Jam
rule MyRule
{
    MyCompile $(1) $(2) ;
}
actions MyCompile
{
    update -o $(1) $(2)
}
Rake
sh "update -o #{t.name} #{t.prerequisites.join(' ')}"
SCons
env.Append(BUILDERS =
  {'MyCompile': Builder(action = 'update -o $TARGET $SOURCE', 
    src_suffix='.in')})
tup
foo.in |> update -o %o %f |> foo
Waf
bld(
    rule     = 'update -o ${TGT} ${SRC}
    source   = 'foo.in',
    target   = 'foo')

Most of these are more verbose than make, and for me the extra text just makes it harder to see what’s really going on. The SCons example is particularly ugly: 6 times the characters to express the same simple command!

Did you mean TAB instead of 8 spaces?

I suspect that at the heart of complaints about make syntax is a single unfortunate confluence of facts. First, make uses a literal TAB character to mark the beginning of a command in a recipe. Second, most code editors automatically replace TAB with spaces. Together these facts conspire to confound even the most experienced makefile writer, resulting in this slightly condescending, always irritating error message:

*** missing separator (did you mean TAB instead of 8 spaces?)

.

I won’t argue with you, this is a real nuisance. But there’s good news: GNU make 3.82 introduced a new special variable called .RECIPEPREFIX. Set this variable to any character you like, and GNU make will use that instead of TAB to mark commands in the makefile. For example:

.RECIPEPREFIX=! all: !@echo Who says make syntax is bad?

Conclusion

Don’t get me wrong: as with any tool, there is room for improvement in make. I agree with John’s suggestion to optionally include command-lines and input file checksums in the up-to-date decisions (some of that is available now in ElectricAccelerator). Beyond that I think it would be great to add support for non-pattern rules with multiple outputs — there’s no way to do that now, although there are a variety of hacks to emulate non-pattern rules with multiple outputs. The interesting thing about these ideas is that all of them can be added to make, without requiring the creation of a completely new build tool.

Yes, make syntax is terse, but the lack of extraneous noise makes it easier to see what’s going on in a makefile than in a comparable build file from another tool. Likewise, make syntax is old, but rather than being a weakness, I see that as a testament to it’s fitness. Surely it’s telling that in 30 years, nothing else has come along that is obviously better, or sufficiently better to justify the cost of migration.

Shell commands in GNU make

For new users, the relationship between make and the shell can be confusing. I think people get thrown off by the make-specific syntax in makefiles — all those colons and at signs and percents. But the truth is that most of the content in a makefile is commands that are executed by the shell.

With GNU make, there are two ways to invoke shell commands from a makefile:

Recipes: the go-to-guy of shell commands in make

The recipe of a rule is the workhorse of gmake/shell integration. Structurally, the recipe is the list of commands used to generate the output file — each of the tab-initiated lines following a target: prereq declaration in the makefile. In the following makefile fragment, I highlighted the recipe in red (note that the commands shown here are for illustration only; in a real makefile, you should use variables like $(CC), $@ and $< to ensure the makefile is portable and flexible):

foo.o: foo.c foo.h
echo 'building foo.o' gcc -c -o foo.o foo.c echo 'done with foo.o'

You can think of the commands in a recipe as being invoked using the common idiom sh -c “command”. That means that you can use standard shell constructs like process pipelines and for loops. In turn, that flexibility means that recipes should be your “go-to guy” when it comes to invoking shell commands from a makefile. Want to preprocess your sources with sed before sending it to the compiler? Just tweak your recipe:

foo.o: foo.c foo.h echo 'building foo.o' sed -e 's/foo/bar/g' foo.c | gcc -c -o foo.o -xc - echo 'done with foo.o'

So recipes are the primary way to invoke shell commands in make. Here are some guidelines to remember:

If possible, gmake will invoke commands directly rather using the shell.

Essentially, gmake scans the command-line for shell built-ins (like for and if) and “shell special characters” (like | and &). If none of these are present in the command-line, gmake will
avoid the overhead of the shell invocation by invoking the command directly (literally just using execve to run the command).

Note that if you change the shell gmake uses by setting the SHELL makefile variable, then gmake will always use the shell to invoke commands, since it can’t know what commands and characters are “special” to your custom shell.

gmake expands command-lines before executing them.

Command expansion is why you can use gmake features like variables (eg, $@) and functions (eg, $(foreach)) in the recipe. It is also why you must use double dollar signs if you want to reference shell variables in your recipe:

abc: def let foo=1 ; echo $$foo

gmake executes each line in a recipe separately.

That means that there’s no sharing of state from one command to the next, and it’s why recipes like the following don’t work as expected:

abc: def
let foo=1 echo $$foo

Because this recipe contains two lines, gmake executes it in two pieces:

sh -c "let foo=1" sh -c "echo $foo"

It’s obvious why this recipe doesn’t work, when written out that way: the variable assignment occurs in one shell, but the reference occurs in another. But there’s an easy way around this: line continuations. You’ve probably seen this technique in use:

abc: def
let foo=1 ; \ echo $$foo

Now gmake executes the recipe using a single shell invocation:

sh -c "let foo=1 ; echo $foo"

Nota bene: if you are using gmake 3.82 or later, you can enable the .ONESHELL feature, which causes gmake to invoke the entire recipe using a single shell invocation, even if you haven’t used line continuations.

The $(shell) function

The $(shell) function is the second way to invoke the shell from gmake. It’s intended purpose is to capture the output of a command into a gmake variable. For example, you could save the name of the current user in the variable USERNAME this way:

USERNAME := $(shell whoami)

$(shell) takes a single argument, the command to run. Just like commands in recipes, if there are shell constructs in the command gmake will invoke it using sh -c “command”; otherwise, gmake will invoke the command directly. Likewise, gmake will expand variable and function references in the command before invoking it, so you must use double-dollar-signs to reference shell variables in that context:

TARGETS := $(shell for n in `seq -w 1 10`; do echo $$n; done)

Here are some guidelines to help you use $(shell) correctly and effectively:

If you’re not capturing the result of $(shell) to a variable, you’re probably misusing $(shell).

Here’s a real-world example of how not to use $(shell):

$(shell touch targets.mk) include targets.mk all: $(TARGETS)

The intent here was to ensure that targets.mk exists before gmake tries to include it. One problem with this approach is that it will touch the file every time you invoke the makefile, even on a “no touch” build! The correct way to accomplish this is with a proper rule for targets.mk:

include targets.mk all: $(TARGETS) targets.mk: @touch targets.mk

If targets.mk doesn’t exist, it will be created. Note that this particular example exploits the makefile remaking feature in gmake; in general though, if you’re using $(shell) this way, you can probably transform that usage into a regular rule, and get better performance and a more robust makefile for your trouble.

If you’re using $(shell) in a recipe, you’re probably misusing $(shell).

Another real-world example of $(shell) abuse:

foo.o: foo.c $(shell sed -e 's/foo/bar/' $< | gcc -o $@ -xc -)

Now that you know that recipes are implicitly using the shell, you can see that this use of $(shell) is utterly superfluous. The problem with this is that it moves the work into the command expansion phase, which means it can’t run in parallel with gmake. The fix for this one is to just drop the $(shell) call:

foo.o: foo.c sed -e 's/foo/bar/' $< | gcc -o $@ -xc -

Always use := assignment with $(shell).

I’ve written before about the importance of using := assignment with $(shell). In short: not using := assignment can cause your makefile to invoke the shell far more often than you realize, which can be a performance problem, and leave you with unpredictable build results. Always use := assignment with $(shell).

Conclusion

Hopefully now you see that the relationship between gmake and the shell is not so mysterious after all. Just remember: when in doubt, use a recipe, and don’t use $(shell) unless you’re capturing the result into a variable.

Blinkenlights for ElectricAcclerator

Watching builds run is boring. I mean, there’s not really much to look at, besides the build log scrolling by. And the “bursty” nature of the output with ElectricAccelerator makes things even worse, since you’ll get a long pause with no apparent progress, followed by a blast of more output than you can handle — like drinking from a fire hose. Obviously stuff is going on during that long pause, but there’s nothing externally visible. Wouldn’t it be nice to see some kind of indication of the build progressing? Something like this:

I put together this visualization to satisfy my desire for a blinkenlights display for my build. Each light represents an agent used by the build, and it lights up every time a new job is dispatched to that agent. There’s no correlation between the amount of time it takes for the light to fade and the duration of the job, since there’s no way to know a priori how long a job will take. But if the build consists primarily of jobs that are about the same length (and most builds do), then you should see a steady stream of flashes throughout.

–emake-monitor

This visualization is powered by a relative new feature in ElectricAccelerator: add –emake-monitor=host:port to the emake command-line, and emake will broadcast status messages to the specified destination using UDP. As of Accelerator 5.2.0, emake generates four types of status messages. Each message is transmitted in plain text, as a space-separated list of words. The first word indicates the type of message; the remaining words are the parameters of the message:

  • ADD_JOB jobId jobType targetName: a new job has been added to the work queue.
  • START_JOB jobId time agent: a job has started running on the specified agent.
  • FINISH_JOB jobId time: a job has finished running.
  • FINISH_BUILD: the build has completed.

All you need is a program that listens for these messages and does something interesting with them. ElectricInsight is one such program: select the File -> Monitor live build… menu option, enter the same host:port information, and Insight will render the jobs in the build in real time as they run. Not bad, but not as glitzy as I’d like.

Writing blinkenlights

My blinkenlights visualization uses just one of the messages: START_JOB. Each time it receives the message, it maps the agent named in the message to one of the lights, illuminates it, and then fades it at a fixed rate. It’s written in Tcl/Tk, naturally, using a couple great third-party extensions, so the implementation is less than 100 lines of code.

The first extension is Tkpath, which I’ve mentioned previously. I used prect items to create the “lights”, and handled the fading effect by just progressively decreasing the alpha from fully opaque to fully transparent with a series of timer events firing at a predetermined rate.

The second extension is TclUDP, which makes it trivial to connect to a UDP socket from Tcl. Once I have that socket, I can use all the regular Tcl magic like fileevent to make my script automatically respond to the arrival of a new message.

Here’s the code in full:

package require tkpath
package require udp

# fade - update the opacity of the given item to the given value.  Afterwards,
# schedules another event to update the opacity again, to a slightly smaller
# value, until the value reaches zero.

proc fade {id {count 100}} {
    global events
    .c itemconfigure a$id -fillopacity [expr {double($count) / 100}]
    incr count -5
    catch {after cancel $events($id)}
    if { $count >= 0 } {
        set events($id) [after 5 [list fade $id $count]]
    }
}

# next - called whenever there is another message awaiting on the socket.

proc next {sock} {
    global ids
    set msg [read $sock]
    if { [lindex $msg 0] eq "START_JOB" } {
        set agent [lindex $msg 3]
        if { ![info exists ids($agent)] } {
            set ids($agent) [array size ids]
        }
        fade $ids($agent)
    }
}

# Set the dimensions; my test cluster has 16 agents, so I did a 4x4 layout.

set rows 4
set cols 4
set boxx 60
set boxy 60

# Set up the tkpath canvas and the "lights".

set c [::tkp::canvas .c -background black \
           -height [expr {($boxy * $rows) + 5}] \
           -width  [expr {($boxx * $cols) + 5}]]
wm geometry . [expr {($boxx * $cols) + 27}]x[expr {($boxy * $rows) + 27}]

for {set x 0} {$x < $cols} {incr x} {
    for {set y 0} {$y < $rows} {incr y} {
        set x1 [expr {($x * ($boxx + 5)) + 5}]
        set x2 [expr {$x1 + $boxx}]
        set y1 [expr {($y * ($boxy + 5)) + 5}]
        set y2 [expr {$y1 + $boxy}]
        set id [expr {($x * $rows) + $y}]
        .c create prect $x1 $y1 $x2 $y2 -rx 5 -fill #3399cc -tags a$id \
            -fillopacity 0
    }
}
pack .c -expand yes -fill both
wm title . "Cluster Blinkenlights"
update

# Get the host and port number from the command-line.

set host [lindex [split $argv :] 0]
set port [lindex [split $argv :] 1]

# Create the udp socket, set it to non-blocking mode, then set up a fileevent
# that will trigger anytime there's data available on the socket.

set sock [udp_open $port]
fconfigure $sock -buffering none -blocking 0 -remote [list $host $port]
fileevent $sock readable [list next $sock]

# Common idiom to keep the app running indefinitely.

set forever 0
vwait forever

Future work

This is a pretty fun way to monitor the status of a build in progress, but I think there are two things that could make it even better:

  • Watch the entire cluster, instead of just one build. Because this visualization is driven by data streaming from emake, for all practical purposes it’s limited to showing the activity in a single build. I would love to instead be able to view a single display showing the entire cluster, with concurrently running builds flickering in different colors. I think that would be a really interesting display, and might provide some insight into the cluster sharing behaviors of the entire system. I think to really do that properly, we’d need to be intercepting events from every agent, but unfortunately the agent doesn’t have a feature like –emake-monitor.
  • Make it an actual physical gadget. It might be fun to wire together some LED’s, maybe controlled by an arduino or something, to make a tangible device that could sit on my desk. It’s been a long, long time since I’ve done anything like that though. Plus, if there are a lot of agents in the cluster, it may be costly and impractical to manufacture.

What do you think?

How many agents did my build use?

When you run a parallel build, how many jobs are actually running in parallel during the life of the build? If you’re using ElectricAccelerator, you can load the build annotation file in ElectricInsight and eyeball it, as long as you have a small, uncongested cluster. But if you have a big cluster, and lots of other builds running simultaneously, the build may touch many more distinct agents than it actually uses simultaneously at any given point. It’d be great to see a simple chart like this:

With this graph I can see at a glance that this build used 48 agents most of the time, although there was a lot of time when it used only one agent, probably due to serializations in the build. In this post I’ll show you how to generate a report like this using data from an annotation file.

Counting agents in use

Counting the agents in use over the lifetime of the build is a simple algorithm: make a list of all the job start and end events in the build, sorted by time. Then scan the list, incrementing the count of agents in use every time you find a start event, and decrementing it every time you find an end event. Here’s the code, using annolib, the annotation analysis library:

#!tclsh
load annolib.so

proc CountAgents {annofile} {
    global anno total

    set xml  [open $annofile r]
    set anno [anno create]
    $anno load $xml

    # These values will tell us what type of event we have later.

    set START_EVENT  1
    set END_EVENT   -1

    # Iterate through all the jobs in the build.

    set first [$anno jobs begin]
    set last  [$anno jobs end]
    for {set job $first} {$job != $last} {set job [$anno job next $job]} {
        # Get the timing information for this job.  If this job was not
        # actually run, its timing information will be empty.

        set t [lindex [$anno job timing $job] 0]
        if { [llength $t] == 0 } {
            continue
        }
        foreach {start end agent} $t {
            break
        }

        # Add a start and an end event for this job to the master list.

        lappend events [list $start $START_EVENT] [list $end $END_EVENT]
    }

    # Order the events chronologically.

    set events [lsort -real -increasing -index 0 $events]

    # Scan the list of events.  Every time we see a START event, increment
    # the count of agents in use; every time we see an END event, decrement
    # the count.  This way, "count" always reflects the number of agents
    # in use.

    set count 0
    set last  0
    foreach event $events {
        foreach {t e} $event { break }
        if { ![info exists total($count)] } {
            set total($count) 0
        }

        # Add the time interval between the current and the previous event 
        # to the total time for "count".

        set total($count) [expr {$total($count) + ($t - $last)}]

        # Update the in-use counter.  I chose the event type values
        # so that we can simply add the event type to the counter.

        incr count $e

        # Track the current time, so we can compute the size of the next
        # interval.

        set last $t
    }
}

CountAgents [lindex $argv end]

After this code runs, we’ll have the amount of time spent using one agent, two agents, three agents, etc. in the global array total. The only thing left to do is output the result in a usable form:

set output "-raw"
if { [llength $argv] >= 2 } {
    set output [lindex $argv 0]
}
switch -- $output {
    "-raw" {
        foreach count [lsort -integer [array names total]] {
            if { $total($count) > 0.0001 } {
                puts "$count $total($count)"
            }
        }
    }

    "-text" {
        set duration [$anno duration]
        puts "Agents in use by portion of build time"
        foreach count [lsort -integer [array names total]] {
            set len [expr {round(double($total($count)*70) / $duration)}]
            if { $len > 0 } {
                puts [format "%2d %s" $count [string repeat * $len]]
            }
        }
    }

    "-google" {
        set url "http://chart.apis.google.com/chart"
        append url "?chs=300x225"
        append url "&cht=p"
        append url "&chtt=Agents+in+use+by+portion+of+build+time"
        append url "&chco=3399CC"
        set lbl ""
        set dat ""
        set lblsep ""
        set datsep ""
        set duration [$anno duration]
        foreach count [lsort -integer [array names total]]  {
            set pct [expr {($total($count) * 100) / $duration}]
            if { $pct >= 1.0 } {
                append lbl $lblsep$count
                append dat $datsep[format "%0.2f" $pct]
                set lblsep "|"
                set datsep ","
            }
        }
        append url "&chd=t:$dat"
        append url "&chl=$lbl"
        puts $url
    }
}

This gives us three choices for the output format:

  • -raw, which just dumps the raw data, one entry per line.
  • -text, which formats the data as a simple ASCII bar chart.
  • -google, which emits a Google Charts URL you can put into your browser to see a chart like the one at the top of this post.

For example, if I run this script as tclsh count_agents.tcl -text sample.xml, the output looks like this:

Agents in use by portion of build time 0 *** 1 ***************** 2 *** 3 * 4 * 5 * 47 * 48 ************************************

So that’s it: another trivial annolib script, another slick build visualization!

Faster builds through smarter scheduling: longest job first

One idea that comes up now and then is to speed up parallel builds by being smarter about the order used to run the jobs in the build. Obviously we don’t have complete control over the order — we have to respect the dependencies, of course — but at any given point there are probably multiple jobs ready-to-run. All things being equal, the build ought to finish sooner if we start the longest jobs first. But does it really work out that way?

A compelling example

Here’s an example that a user posted on the GNU make mailing list:

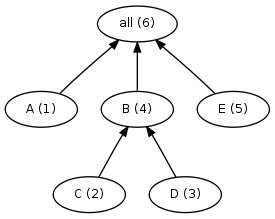
all: A B E A: ; # 3-minute job. B: C D ; # 1-minute job. C D: ; # 1-minute job. E: ; # 6-minute job.

Here’s the dependency graph for this simple makefile. The numbers in parenthesis indicate the serial order of the jobs in the build — the order the jobs will execute if the build runs serially:

Dependency graph for a simple build, with serial order marked

The serial order is also the order that make will start the jobs when running in parallel. For example, if we run this makefile with gmake -j 2, we would see the execution proceed as follows:

  • 0 minutes: gmake start jobs A and C.
  • 1 minute: C completes and gmake starts D (two minutes left on job A).
  • 2 minutes: D completes and gmake starts B (one minute left on job A).
  • 3 minutes: A and B complete, and gmake starts E.
  • 9 minutes: E completes, and the build ends.

Visually, it looks like this:

But this ordering is obviously quite inefficient. Job E is not dependent on any other jobs, so there’s no reason we can’t start it sooner. In fact, if we start E first, then the execution looks like this:

By starting the longest jobs first, we can trim the overall build time by an impressive 30%! So: obviously we can fabricate a build that shows significant improvement by use of a longest-job-first scheduler. But will we see similar results from real builds?

Look before you leap

To answer this question, I made a build simulator that simulates running a build using longest-job-first scheduling. The simulator uses job duration and dependency information from an annotation file generated during a real build with ElectricAccelerator, a high-performance gmake replacement.

I tested the longest-job-first scheduler on several builds:

  • MySQL
  • Samba
  • Mozilla

To my disappointment, the new scheduler showed no significant benefit on these builds:


Build times in real builds are virtually unchanged with the longest-job-first scheduler. On some of these graphs you can barely even tell there are two distinct lines!

What went wrong?

I think there are two factors that explain this lackluster result. The first is homogeneity: in most builds, the majority of the jobs are more-or-less the same length. For example, 90% of the jobs in the Mozilla build are less than 0.25s long. 80% of the jobs in the Samba build are in the 2.5s to 5.0s range. What difference does it make to choose job A or job B when they both have nearly identical durations? Now, maybe you’re thinking “A-ha! What about the link job? That’s definitely longer than the other jobs!” And it’s true, the link job often is longer. But by its nature it can’t start any sooner than after all the other jobs have finished anyway — so again the longest-job-first scheduler has no choice to make, because there is only one job to choose.

The second factor is the longest-job-first scheduler is smarter, but not smart enough: by considering only the length of each job in isolation, the longest-job-first scheduler cannot account for situations where a short job blocks a very long job. For example, suppose that we change our original example by adding a prereq for job E:

all: A B E A: ; # 3-minute job. B: C D ; # 1-minute job. C D: ; # 1-minute job. E: F ; # 6-minute job. F: ; # 10-second job.

Because job F is so short, the longest-job-first scheduler will never prioritize it over jobs A, B, C, or D — in fact, the scheduler won’t run job F until it is literally the only choice left. Unfortunately, that means that job E won’t run until the end of the build, clobbering our overall build time.

Where do we go from here?

From these simulations, it’s clear that there’s little point in pursuing a simple longest-job-first scheduler. But I think there may be something to the idea of a scheduler that considers not just individual job lengths but the relationships between jobs. I’ll explore that possibility in a future post.

How long are the jobs in my build? part 2

In response to my post about visualizing the lengths of the jobs in a build, one reader suggested a few tweaks to my gnuplot script to make the graph a proper surface plot. I like the look of this:

This version addresses some of the short-comings of my original:

  • It’s easier to determine the z-coordinate of a given point. In the original that was nearly impossible. It’s still a little tricky here because of the perspective, but it’s a step in the right direction.
  • Lower layers are not obscured. Originally, a dense layer of points could obscure points with a lower z-value. This version avoids that problem because you can see places where the surface dips.

Unfortunately, this version introduces some new problems:

  • Raw data points are averaged. In order to produce this surface plot, gnuplot computes a weighted average of the data points. Averaging itself is not necessarily a problem. The trouble here is that the layout of the data points is completely arbitrary, as you may recall from the previous post. That means that this plot effectively picks a handful of random data points, averages them, and plots the result. We still see the general trend — that most of the jobs are about the same length — but it feels a bit phony.
  • Implies patterns where there are none. When I first saw this image, I was struck by the “mountain range” running across the plot, a bit left of center. I hadn’t seen that in my original graph, so naturally I was intrigued. I spent hours trying to understand why that feature might be present, and finally came to this conclusion: it isn’t real. It’s just an artifact of the graphing method. Remember, the layout of the points is completely arbitrary, so it would be quite odd for there to really be a pattern like this cutting across the plot. In fact, I found that similar “features” appeared no matter what dimensions I used for the plot. I think the reason is that in this mode, gnuplot is not plotting the raw data, but rather a weighted average of adjacent points. This will tend to introduce relationships between those points that are not actually real.

OK, so this revised version is definitely interesting. I’m not sure that it’s better necessarily, given the defects I mentioned above. And unfortunately it doesn’t help at all with the issue of making something useful out of the X/Y coordinates. Nevertheless, thanks Aaron for the suggestion!

How long are the jobs in my build?

I’ve been playing with a new visualization for build data. I was looking for a way to really hammer home the point that in most builds, the vast majority of jobs are more-or-less the same length. The “Job Count by Length” report in ElectricInsight does the same thing, but in a “just the facts” manner. I wanted something that would be more visceral.

Then I struck on the idea of mapping the jobs onto a surface plot, using the job duration as the z-coordinate or “height”, so longer jobs have points high above the z-axis. In such a view, we would expect to see a mostly flat plain, with a small portion of points above the plain. Sure enough, that’s just what we get. Here’s an example, generated using data from a mozilla build:

Here’s what I like about this visualization:

  • Nails the primary goal. This visualization is great at demonstrating that most jobs in the build have about the same duration.
  • It’s looks cool. Given a choice between two visualizations that show the same data, the one that looks cooler definitely has an advantage.

Now, here’s what I don’t like about this visualization:

  • X- and Y-coordinates are arbitrary. For this prototype I just determined the smallest box large enough to show all the jobs in the build, then plotted the first job at 0,0; the second at 0,1, etc. This is simple, and it gives a compact display, but it would be nice if the X- and Y-coordinates had some actual meaning.
  • It’s hard to tell what Z-coordinate any given point has. For example, I can easily see that the vast majority of jobs have roughly the same duration, but what duration is that? 0 seconds? 1 second? 1/2 second?
  • A dense upper layer obscures lower layers. Although this build is unimodal, suppose it was instead bimodal — the density of points at height 5 might obscure the existence of points at height 3.

For comparison, here’s the “Job count by Length” report from ElectricInsight. It uses the same data, and tells the same story, but it’s not nearly as visually dramatic:

So, what do you think? Any ideas how I could use the X- and Y-coordinates to convey useful information? Keep reading if you want to see how I made this visualization.
(more…)