ElectricAccelerator Job Compendium

The fundamental unit of work in ElectricAccelerator is the job. Most of the time, you can think of a job as all the commands that must be run in order to create or update a single build output, but in truth that describes only one type of job. There are actually several different job types, each with a distinct purpose in the structure of a build and the way Accelerator executes the build. You can determine the type of a job from the type attribute on the <job> tag in Accelerator annotation files.

Having some familiarity with the job types and their use will make it easier for you to understand Accelerator performance and behavior, so I wrote this guide to introduce them. First I’ll describe the jobs used by ElectricMake (emake), and then the jobs used by Electrify.

ElectricMake jobs

In order to make the descriptions more concrete, I created a simple reference build that uses each of the most common job types, so you can see exactly how the jobs relate to a real build. Here’s the reference build makefile:

prog: 
        @$(MAKE) sub/prog
        @cp sub/prog ./prog

sub/prog: sub/main.c
        @cat $< > $@

setup:
        rm -rf prog sub
        mkdir sub
        echo "int main() { return 0; }" > sub/main.c
        touch prog2

To run the build, first run emake setup, which will create the files and directory structure needed by the build, then run emake –emake-maxagents=1 –emake-annodetail=basic –emake-annofile=emake.xml prog prog2. That will produce a build with thirteen different jobs, in two different make instances. Here’s an overview of how those jobs fit together (click for a larger image):


parse

The first job in any make invocation (and therefore the first job of any emake build) is a parse job, during which emake reads and interprets the makefiles used in that make instance. The output of a parse job is a list of all the jobs in the make instance, along with a list of targets that must be built, the commands to build those targets, and the relationships between them.


exist

Existence jobs (marked as type “exist” in annotation) are used to check for the existence of makefiles and command-line goals for which no rule was found. In our reference build, you can see an existence job in the top-level make for the makefile itself, as well as one for the file prog2, which has no rule in the makefile.


remake

Remake jobs are at the center of emake’s emulation of GNU make makefile remaking feature. In a remake job, emake checks every makefile that was read during the parse job for two things:

  1. Is there a rule to rebuild the makefile; and
  2. Was the makefile actually rebuilt (because it was out-of-date).

If any makefile was rebuilt, then emake restarts the make instance — all the way back to the parse job.

Because makefile remaking is a gmake-specific feature, you will only see remake jobs when emake is emulating gmake — not when it’s emulating NMAKE.

One last note about remake jobs: emake overloads the use of the <failed> tag inside a remake job to indicate not failure, but whether or not the job determined that the make instance should be restarted. If yes, then the remake job will include a <failed> tag with the code attribute set to 1; if not, then the remake job will have no <failed> tag.


rule

Rule jobs are the real workhorses of a build. Each rule job encapsulates the commands needed to update one target in the build — literally the body of a rule from a makefile — and a rule always has an associated output target (or targets), which is identified by the name attribute of the job tag in annotation. In our reference build, the rule job in the toplevel make instance corresponds to this rule in the makefile:

prog: 
        @$(MAKE) sub/prog
        @cp sub/prog ./prog

If you look at the annotation for the job you’ll notice that only $(MAKE) sub/prog is actually in the rule job — because the cp sub/prog ./prog was automatically split into a continuation job when emake detected the recursive make invocation.


follow

A follow job serves two purposes. First, it is a connection point that allows emake to tie the end job of a recursive make invocation back into the ordered list of jobs in the parent make. Second, it is the means by which emake propagates the error status of a recursive make to the parent make.

Follow jobs always have an associated rule or continuation job, identified by the partof attribute on the job tag in annotation. That is the job that spawned the recursive make which the follow job is associated with. Of course, not all rule and continuation jobs have an associated follow job — follow jobs only show up when a recursive make was invoked.


continuation

A continuation job represents the “leftover” commands that follow a recursive make invocation in a rule (or continuation) job. In our reference build, emake creates a continuation job for cp sub/prog ./prog, because that command follows a recursive make invocation. Continuation jobs, like follow jobs, are always associated with a rule (or another continuation) job, identified by the partof attribute on the job tag in the annotation.

The reason for splitting the extra commands into a separate job is simple: that allows emake to easily specify the serial order of those commands relative to the jobs in the recursive make — the commands in the continuation come after the jobs in the recursive make.


end

The last job in every make instance (and therefore the last job of every emake build) is an end job. End jobs exist primarily to handle end-of-the-make cleanup, such as removing intermediate targets or temporary inline files that were created while executing the other jobs in the make.


(Not pictured) subbuild

Subbuild jobs, which were not used in the reference build, are part of emake’s subbuild feature. They are simply a mechanism to inject a recursive make invocation into the build, just as you would get if you had a rule job with a $(MAKE) command, but without the tedium of actually running that command.

Electrify jobs

Electrify uses much of the same underlying machinery that emake does, but it has its own set of job types for its particular needs.


alpha

Every electrify build starts with an alpha job, which is a trivial placeholder marking the start of the list of jobs.


external

External jobs represent commands invoked by the electrified build tool which are distributed to the cluster. These are similar to emake’s rule jobs, except they will only ever run a single command, while rule jobs may run any number of commands.


update

Update jobs represent filesystem modifications made by commands invoked by the electrified build tool but not distributed to the cluster. These modifications are detected with the aid of electrifymon.


omega

Every electrify build ends with an omega job, which, like the alpha job, is a trivial placeholder.

Conclusion

I hope you’ve found this post informative. Questions or feedback? Please feel free to comment below!

Maven 3 performance: why all the hubbub, bub?

First off let me say that I have never used Maven, and I honestly don’t know much about it. But I do know a lot about build performance and parallel builds, and I love to look at benchmarks, so naturally I was intrigued by this article on Dr. Dobb’s, which includes a comparison of performance between Maven 2 and Maven 3, the latest release; as well as a comparison between serial and parallel builds using the new parallel build feature in Maven 3.

The thing is, the improvement is not very impressive. Sonatype describes Maven 3 as “dramatically faster” than Maven 2, but according to the published benchmarks, Maven 3 shaves a paltry 5-10 seconds off the Maven 2 build time:

Project Maven 2 Maven 3 Improvement
Maven SCM Trunk 3:20 3:15 5s (2.5%)
“Corporate” 1:04 0:54 10s (15%)

The parallel build feature does better, executing the benchmark builds 1.35x faster (a 25% reduction in build time):

Project Serial Parallel (4 threads) Improvement
Maven SCM trunk 3:15 2:26 49s (25%)
“Corporate” 0:54 0:40 14s (25%)

That’s nothing to scoff at, I suppose, but consider that to obtain that 1.35x speedup, they used 4 threads of parallel execution — that’s the equivalent of make -j 4. With 4 threads of parallel execution you’ll see a 4x speedup, ideally. The benchmark builds here are small, so they are probably dominated by a few large jobs, but even so, with 4 threads you ought to be able to get at least a 2x speedup. For making the jump from serial to 4-way parallel builds, a 1.35x improvement is pretty disappointing.

At first I thought perhaps the author rushed when putting together the Dr. Dobb’s article, and just made a poor choice of benchmarks. But in fact the same benchmarks have been used in a Sonatype blog months before the Dr. Dobb’s article, and apparently in a Jfokus 2011 presentation by Dennis Lundberg.

Where’s the beef?

So what am I missing here? It seems there are only two possibilities:

  1. The performance improvements between Maven 2 and Maven 3 are actually impressive in some cases, and the Maven developers just couldn’t be bothered, over a period of several months, to find more compelling benchmarks; or
  2. The performance improvements between Maven 2 and Maven 3 are just not that impressive, and the published benchmarks are, sadly, representative of the best Maven 3 has to offer at this time.

I know where my money is on that bet.

How ElectricMake guarantees reliable parallel builds

Parallel execution is a popular technique for reducing software build length, and for good reason. These days, multi-core computers have become standard — even my laptop has four cores — so there’s horsepower to spare. And it’s “falling over easy” to implement: just slap a “-j” onto your make command-line, sit back and enjoy the benefits of a build that’s 2, 3 or 4 times faster than it used to be. Sounds great!

But then, inevitably, invariably, you run into parallel build problems: incomplete dependencies in your makefiles, tools that don’t adequately uniquify their temp file names, and any of a host of other things that introduce race conditions into your parallel build. Sometimes everything works great, and you get a nice, fast, correct build. Other times, your build blows up in spectacular fashion. And then there are the builds that appear to succeed, but in fact generate bogus outputs, because some command ran too early and used files generated in a previous instead of the current build.

This is precisely the problem ElectricMake was created to solve — it gives you fast, reliable parallel builds, regardless of how (im)perfect your makefiles and tools are. If the build works serially, it will work with ElectricMake, but faster. If you’ve worked with parallel builds for any length of time, you can probably appreciate the benefit of that guarantee.

But maybe you haven’t had much experience with parallel builds yourself, or maybe you have but like many people, you don’t believe this problem can actually be solved. In that case, perhaps some data will persuade you. Here’s a sample of open source projects that don’t build reliably in parallel using gmake:

For each, I did several trials with gmake at various levels of parallelism, to determine how frequently the parallel build fails. Then, I did the same build several times with emake and again measured the success rate. Here you can see the classic problem of parallel builds with gmake — works great at low levels of parallelism (or serially, the “degenerate” case of parallel!), but as you ratchet up the parallelism, the build gets less and less reliable. At the same time, you can see that emake is rock solid regardless of how much parallelism you use:

Parallel build success rates

The prize for this reliability? Faster builds, because you can safely exploit more parallelism. Where gmake becomes unreliable with -j 3 or -j 4, emake is reliable with any number of parallel jobs.

How ElectricMake guarantees reliable parallel builds

The technology that enables emake to ensure reliable parallel builds is called conflict detection. Although there are many nuances to its implementation, the concept is simple. First, track every modification to every file accessed by the build as a distinct version of the file. Then, for each job run during the build, track the files used and verify that the job accessed the same versions it would have had the build run serially. Any mismatch is considered a conflict. The offending job is discarded along with any filesystem modifications it made, and the job is rerun to obtain the correct result.

The versioned file system

At the heart of the conflict detection system is a data structure known as the versioned file system, in which emake records every version of every file used over the lifetime of the build. A version is added to the data structure every time a file is modified, whether that be a change to the content of the file, a change in the attributes (like ownership or access permissions), or the deletion of the file. In addition to recording file state, a version records the job which created it. For example, here’s what the version chain looks like for a file “foo” which initially does not exist, then is created by job A with contents “abc”, deleted by job C, and recreated by job E with contents “123”:

Jobs

Jobs are the basic unit of work in emake. A job represents all the commands that must be run in order to build a single makefile target. In addition, every job has a serial order — the order in which the job would have run, had the build been run serially. The serial order of a job is dictated by the dependencies and structure of the makefiles that make up the build. Note that for a given build, the serial order is deterministic and unambiguous — even if the dependencies are incomplete, there is exactly one order for the jobs when the build is run serially.

With the serial order for every job in hand, deciding which file version should be used by a given job is simple: just find the version created by the job with the greatest serial order that precedes the job accessing the file. For example, using the version chain above (and assuming that the jobs’ names reflect their serial order), job B should use the version created by job A, while job D should see the file as non-existent, thanks to the version created by job C.

A job enters the completed state once all of its commands have been executed. At that point, any filesystem updates created by the job are integrated into the versioned filesystem, but, critically, they are not pushed to the real filesystem — that gives emake the ability to discard the updates if the job is later found to have conflicts.

Each job runs against a virtual filesystem called the Electric File System (EFS), rather than the real filesystem. The EFS serves several important functions: first, it is the means by which emake tracks file accesses. Second, it enables commands in the build to access file versions that exist in the versioned filesystem, but not yet on the real filesystem. Finally, it isolates simultaneously running jobs from one another, eliminating the possibility of crosstalk between commands.

Detecting conflicts

With all the data emake collects — every version of every file, and the relationship between every job — the actual conflict check is simple: for each file accessed by a job, compare the actual version to the serial version. The actual version is the version that was actually used when the job ran; the serial version is the version that would have been used, if the build had been run serially. For example, consider a job B which attempts to access a file foo. At the time that B runs, the version chain for foo looks like this:

Given that state, B will use the initial version of foo — there is no other option. The initial version is therefore the actual version used by job B. Later, job A creates a new version of foo:

Since job A precedes job B in serial order, the version created by job A is the correct serial version for job B. Therefore, job B has a conflict.

If a job is determined to be free of conflicts, the job is committed, meaning any filesystem updates are at last applied to the real filesystem. Any job that has a conflict is reverted — all versions created by the job are marked invalid, so subsequent jobs will not use them. The conflict job is then rerun in order to generate the correct result. The rerun job is committed immediately upon completion.

Conflict checks are carried out by a dedicated thread which inspects each job in strict serial order. That guarantees that a job is not checked for conflicts until after every job that precedes it in serial order has been successfully verified free of conflicts — without this guarantee, we can’t be sure that we know the correct serial version for files accessed by the job. Similarly, this ensures that the rerun job, if any, will use the correct serial versions for all files — so the rerun job is sure to be conflict free.

ElectricMake: reliable parallel builds

Conceptually, conflict detection is simple — keep track of every version of every file used in a build, then verify that each job used the correct version — but there are many details to its implementation. And in this article I’ve only covered the most basic implementation of conflict detection — after many years of experience and thousands of real-world builds we’ve tweaked the implementation, relaxing the simple definition of a conflict in specific cases in order to improve performance.

The benefit of conflict detection is simple too: reliable parallel builds, which in turn means shorter build times, regardless of how imperfect your makefiles are and how parallel-unsafe your toolchain may be.

Why is SCons so slow?

UPDATE: If you’re coming from Why SCons is not slow, you should read my response

A while back, I did a series of posts exploring the performance of SCons on builds of various sizes. The results were dismal: SCons demonstrated a classic O(n2) growth in runtime, meaning that the length of the build grew in proportion to the square of the number of files in the build, rather than linearly as one would hope. Naturally, that investigation and its results provoked a great deal of discussion at the time and since. Typically, SCons advocates fall back on one particular argument: “Sure, SCons may be slow,” they say, “but that’s the price you pay for a correct build.” Recently, Eric S. Raymond wrote an article espousing this same fundamental argument, with the addition of some algorithmic analysis intended to prove mathematically that a correct build, regardless of the build tool, must necessarily exhibit O(n2) behavior — a clever bit of circular logic, because it implies that any build tool that does not have such abyssmal performance must not produce correct builds!

Naturally, after spending nearly a decade developing a high-performance replacement for GNU make, I couldn’t let that statement stand. This post is probably going to be on the long side, so here’s the tl;dr summary:

  • You can guarantee correct builds with make, provided you follow best practices.
  • The worst-case runtime of any build tool if, of course, O(n2), but most, if not all, builds can be handled in O(n) time, without sacrificing correctness.
  • SCons’ performance problem is caused by design and implementation decisions in SCons, not some pathology of build structure.

What is required to ensure a correct build?

One of the fundamental tenents of the pro-SCons mythos is the idea that it is unique in its ability to guarantee correct builds. In reality, SCons is not doing anything particularly special in this regard. It’s true that by virtue of its design SCons makes it easier to get it right, but there’s nothing keeping you from enjoying the same assurances in make.

First: what is a correct build? Simply put, a correct build is one in which everything that ought to be built, is built. Note that by definition, a from-scratch build is correct, since everything is built in that case. So the question of “correct” or “incorrect” is really only relevant in regards to incremental builds.

So, what do we need in order to ensure a correct incremental build? Only three things, actually:

  1. A single, full-build dependency graph.
  2. Complete dependency information for every generated file.
  3. A reliable way to determine if a file is up-to-date relative to its inputs.

What SCons has done is made it more-or-less impossible, by design, to not have these three things. There is no concept like recursive make in the SCons world, so the only option is a single, full-build dependency graph. Likewise, SCons automatically scans input files in several programming languages to find dependency information. Finally, SCons uses MD5 checksums for the up-to-date check, which is a pretty darn reliable way to verify whether a given file needs to be rebuilt.

But the truth is, you can guarantee correct builds with make — you just have to adhere to long-standing best practices for make. First, you have to avoid using recursive make. Then, you need to add automatic dependency generation. The only thing that’s a little tricky is the up-to-date check: make is hardwired to use file timestamps, which can be spoofed, deliberately or accidentally — although to be fair, in most cases, timestamps are perfectly adequate. But even here, there’s a way out. You can use a smarter version of make that has a more sophisticated up-to-date mechanism, like ElectricMake or ClearMake. You can even shoehorn MD5 checksums into GNU make, if you like.

I can’t deny that SCons has made it easier to get correct builds. But the notion that it can’t be done with make is simply absurd.

What is the cost of a correct build?

Now we turn to the question of the cost of ensuring correctness. At its core, any build tool is just a collection of graph algorithms — first contructing the dependency graph, then traversing it to find and update out-of-date files. These algorithms have well-understood complexity, typically given as O(n + e), where n is the number of nodes in the graph, and e is the number of edges. It turns out that e is actually the dominant factor here, since it is at least equal to n, and at worst as much as n2. That means we can simplify the complexity to O(n + n2), or just O(n2).

Does this absolve SCons of its performance sins? Unfortunately it does not, because O(n2) is a worst-case bound — you should only expect O(n2) behavior if you’ve got a build that has dependencies between every pair of files. Think about that for a second. A dependency between every. pair. of. files. Here’s what that would look like in makefile syntax:

all: foo bar foo.c bar.c foo.h bar.h
foo:     bar foo.c bar.c foo.h bar.h
bar:         foo.c bar.c foo.h bar.h
foo.c:             bar.c foo.h bar.h
bar.c:                   foo.h bar.h
foo.h:                         bar.h

It’s ridiculous, right? I don’t know about you, but I’ve certainly never seen a build that does anything even remotely like that. In particular, the builds I used in my benchmarks don’t look like that. Fortunately, those builds are small and simple enough that we can directly count the number of edges in the dependency graph. For example, the smallest build in my tests consisted of:

2,000 C sources
+ 2,004 headers
+ 2,000 objects
+ 101 libraries
+ 100 executables

6,205 total files

So we have about 6,000 nodes in the graph, but how many edges does the graph contain? Lucky for us, SCons will print the complete dependency graph if we invoke it with scons –tree=all:

+-.
  +-SConstruct
  +-d1_0
  | +-d1_0/SConstruct
  | +-d1_0/f00000_sconsbld_d1_0
  | | +-d1_0/f00000_sconsbld_d1_0.o
  | | | +-d1_0/f00000_sconsbld_d1_0.c
  | | | +-d1_0/lup001_sconsbld_d1_0/f00000_sconsbld_d1_0.h
  ...

The raw listing contains about 35,000 lines of text, but that includes duplicates and non-dependency information like filesystem structure. Filter that stuff out and you can see the graph contains only about 12,000 dependencies. That’s a far cry from the 1,800,000 or so you would expect if this truly were a “worst-case” build. It’s clear, in fact, that the number of edges is best described as O(n).

Although I don’t know how (or even if it’s possible) to prove that this is the general case, it does make a certain intuitive sense: far from being strongly-connected, most of the nodes in a build dependency graph have just one or two edges. Each C source file, for example, has just one outgoing edge, to the object file generated from that source. Each object file has just one outgoing edge too, to the library or executable the object is part of. Sure, libraries and headers probably have more edges, since they are used by multiple executables or objects, but the majority of the stuff in the graph is going to fall into the “small handful of edges” category.

Now, here’s the $64,000 question: if the algorithms in a build tool scale in proportion to the number of edges in the dependency graph, and we’ve just shown that the dependency graph in question has O(n) edges, why does SCons use O(n2) time to execute the build?

Why is SCons so slow?

SCons’ O(n2) performance stems from its graph traversal implementation. Essentially, SCons scans the entire dependency graph each time it is looking for a file to update. n scans of a graph with O(n) nodes and edges equals an O(n2) graph traversal. There’s no mystery here. In fact, the SCons developers are clearly aware of this deficiency, as described on their wiki:

It’s worth noting that the Jobs module calls the Taskmaster once for each node to be processed (i.e., it’s O(n)) and the Taskmaster has an amortized performance of O(n) each time it’s called. Thus, the overall time is O(n^2).

But despite recognizing this flaw, they severely misjudged its impact, because they go on to state that it requires a “pathological” dependency graph in order to elicit this worst-case behavior from SCons. As we’ve shown here and in previous posts, even a terribly mundane dependency graph elicits O(n2) behavior from SCons. I shudder to think what SCons would do with a truly pathological dependency graph!

Obviously the next question is: why does SCons do this? That’s not quite as easy for me to explain, as an outside observer. To the best of my understanding, they rescan the graph just in case new dependencies are added to the dependency graph while evaluating a node in the graph — remember, in SCons the commands to update a file are expressed in Python, so they can easily manipulate the dependency graph even while the build is running.

Is it really necessary to rescan the dependency graph over and over? I don’t think so. In fact, make is proof that it is not necessary. I think there are two ways that SCons could address this problem: first, it could adopt GNU make’s convention of partitioning the build into distinct phases, one that updates dependency information, and a second that actually executes the build. In GNU make, that strategy allows for the introduction of new dependency information, while imposing only a one-time O(n) cost for restarting the make process if any new dependencies are found.

Alternatively, SCons could probably be made smarter about when a full rescan is required. Most of the time, even if new dependencies are added to the graph, they are added to the node being evaluated, not to nodes that were already visited. That is, when you scan a source file for implicit dependencies, you find the dependencies for that file not for other files in the build (duh). So most of the time, a full rescan is massive overkill.

The final word…?

Hopefully this is my last post on the subject of SCons performance. It is clear to me that SCons does not scale to large projects, and that the problem stems from design and implementation decisions in SCons, rather than some pathology in the build itself. You can get comparable guarantees of correctness from make, if you’re willing to invest the time to do things the right way. The payoff is a build system that is not only correct but has vastly better performance than SCons as your project grows. Why wouldn’t you want that?

HOWTO: use Gource with Perforce

You may have heard of Gource, the source code control visualization gadget. It’s a utility that creates an animation of the activity in your source control system, giving a unique view of the life of a project over time. I finally got some time to play around with it a couple weeks ago, and I used it to make a video of the development activity on ElectricAccelerator over the past 9 years. The “full length” version is about 30 minutes long and plays on a loop in the breakroom at the office, but here’s a shorter, anonymized version (I recommend putting this or this in the background to provide a soundtrack for the animation):

I don’t think it’s necessarily very useful, but there’s no denying that it’s enthralling to watch, especially when it represents your own project. This visualization does really drive home one thing though: just how active development on ElectricAccelerator is, even now, after 9 years. I used to think that we would be “done” at some point, maybe a few years after we started. Now I think we may never be — in fact, I hope we aren’t!

Integrating Gource and Perforce

Gource is what I call “falling over easy” to use. At least, it is if you’re using one of the source control systems it supports natively. Unfortunately, Gource doesn’t directly support Perforce, our source control system, so to make the video above, I had to convert our Perforce commit logs to a format Gource could handle. That’s not too hard to do actually, and in fact several people have written scripts to do it.

Only trouble is, those adapters don’t handle big projects with many branches very well. Instead, they seem to be designed to handle simple projects with one or a few branches, or to enable visualization of just one of the many branches in your project. Either way, that doesn’t work for us. We’ve got about 30 branches in the Accelerator depot, since we make a new branch for each release, as well as for specific large features that we expect will take a long time to complete, so we can’t simply show all the branches. And if we show just one branch, such as our main branch, the trunk of the tree, the visualization will tend to significantly over-represent my contributions, because I handle most of the cross-branch merges.

So I wrote my own adapter: p42gource.tcl. The key differences in this adapter compared to others are that it incorporates activity from as many branches as you specify; and it ignores branch and integrate operations, since those are merely echoes of “interesting” operations on other branches.

Now, getting from Perforce commit logs to Gource is simple (NB: before using p42gource.tcl, you have to edit it to add the list of branches you want to include in the conversion):

$ # Get the id of the last submitted changelist
$ p4 changes -s submitted -m 1 | awk '{print $2}'
50594
$ # Get the details for each changelist
$ for n in {1..50594} ; do p4 describe -s $n >> p4.log ; done
$ # Create a Gource-style log from the Perforce data
$ tclsh p42gource.tcl < p4.log > gource.log
$ # Run Gource
$ gource --log-format custom gource.log

Give it a try!

What’s new in ElectricAccelerator 5.4.0

This month, Electric Cloud announced the release of ElectricAccelerator 5.4. This version adds a lot of great new features, including support for GNU Make’s .SECONDEXPANSION feature and the use of $(eval) in rule bodies, and compatibility with Cygwin 1.7.7. In addition to those long-awaited improvements, here are the things that I’m most excited about in this release:

New cluster utilization reports

Accelerator 5.4 includes two new reports designed to give you greater insight into the load on and utilization of your cluster: the Cluster Utilization report and the Sealevel report:

The Cluster Utilization report shows, over the course of a typical day, the average number of builds running and the average combined agent demand from all running builds. The Sealevel report shows the raw agent demand data, plotted over the course of a day. The colored bands correspond to various cluster sizes, including the current cluster size and several hypothetical sizes, so you can see at a glance how large you need to make the cluster in order to satisfy all the agent requests. The percentages on the right side of the graph indicate the portion of agent requests that are left unsatisfied with a cluster of the given size. In the example above, all but 1% of agent requests would be satisfied if the cluster had 40 agents.

Reduced directory creation conflicts

Raise your hand if you’ve ever seen this pattern in a makefile:

%.o: %.c
        @mkdir -p $(dir $@)
        @$(COMPILE.c) -o $@ $<

It’s a common way to ensure the output directory exists before trying to create a file in it. Unfortunately, with a strict application of Accelerator’s conflict detection algorithm, this pattern causes numerous conflicts and poor performance when the build is run without an up-to-date history file. In Accelerator 5.4.0, we improved the algorithm so that this common case is no longer considered a conflict. If you always run with a good history file, this change will not be helpful to you. But sometimes that’s not possible — for example, if you’re building third-party code that’s just gotten a major update — then you’re going to really love this improvement. The Android source code is a perfect example: a from-scratch no-history build of the Gingerbread base used to take 144 minutes. Now it runs in just 22 minutes on the same hardware — 6.5x faster.

New Linux sandbox implementation

The last feature I want to mention here is the new sandbox implementation for Linux. The sandbox is the means by which Accelerator is able to present a different view of the filesystem, from a different point of time during the build, to each of the jobs running concurrently on a given agent host. Without the sandbox, it would be impossible on Linux to simultaneously represent a given file as existent to one job, and non-existent to another.

In previous versions of Accelerator, the Linux sandbox implementation was effective, but ultimately limited in its capabilities. Chief among those limitations was an inability to interoperate with autofs 5.x. There were several workarounds available, but each of those in turn had its own shortcomings.

Accelerator 5.4 uses a different underlying technology to implement the sandbox component: lofs, the loopback filesystem. This is a concept borrowed from Solaris, which has had a vendor-supplied version for years; Linux has nothing that matches the depth of functionality provided by Solaris, so we wrote our own. The net result of this effort is that the limitations of the previous implementation have been entirely eliminated. In particular, Accelerator 5.4 can interoperate with autofs 5.x without the need for any workarounds or awkward configuration.

Afterthoughts

It’s been a long time in coming, but I think it was well worth the wait. I’m very proud to have been part of this product release, and I’m thrilled with the work my team has put into it.

Accelerator 5.4 is available immediately for current customers. New customers should contact sales@electric-cloud.com.

HOWTO: ship a custom kernel driver for Linux

Pop quiz, hotshot: your company has developed a Linux kernel driver as part of its product offering. How do you deliver this driver such that your product is compatible with a significant majority of the Linux variants you are likely to encounter in the field? Consider the following:

  • RedHat Enterprise Linux 4 is based on kernel version 2.6.9
  • RHEL 5 is based on kernel version 2.6.18
  • RHEL 6 is based on 2.6.32
  • openSUSE 11.0 is based on 2.6.25
  • openSUSE 11.1 is based on 2.6.27
  • Ubuntu 9.04 is based on 2.6.28
  • Ubuntu 9.10 is based on 2.6.31
  • Ubuntu 10.04 is based on 2.6.32
  • Ubuntu 10.10 is based on 2.6.35

I could go on, but hopefully you get the point — “Linux” is not a single, identifiable entity, but rather a collection of related operating systems. And thus the question: how do you ship your driver such that you can install and use it on a broad spectrum of Linux variants? This is a problem that I’ve had to solve in my work.

Fundamentally, the solution is simple: ship the driver in source form. But that answer isn’t much help unless you can make your driver source-compatible with a wide range of kernel versions, spanning several years of Linux development. The solution to that problem is simple too, in hindsight, and yet I haven’t seen it used or described elsewhere: test for specific kernel features using something like a configure script; set preprocessor macros based on the results of the tests; and use the macros in the driver source to conditionally include code as needed. But before I get into the details of this solution, let’s look briefly at a few alternative solutions and why each was rejected.

Rejected alternatives: how NOT to ship a custom driver for Linux

Based on my informal survey of the state-of-the-art in this field, it seems there are three common approaches to solving this problem:

  1. Arrange for your driver to be bundled with the Linux kernel. If you can pull this off, fantastic! You’ve just outsourced the effort of porting your driver to the people who build and distribute the kernel. Unfortunately, kernel developers are not keen on bundling drivers that are not generally useful — that is, your driver has to have some utility outside of your specific application, or you can forget getting it bundled into the official kernel. Also, if you have any interesting IP in your driver, open-sourcing it is probably not an option.
  2. Prebuild your driver for every conceivable Linux variant. If you know which Linux variants your product will support, you could build the driver for each, then choose one of the prebuilt modules at installation time based on the information in /etc/issue and uname -r. VMWare uses this strategy — after installing VMWare Workstation, take a look in /usr/lib/vmware/modules/binary: you’ll find about a hundred different builds of their kernel modules, for various combinations of kernel versions, distributions and SMP-status. The trouble with this strategy is that it adds significant complexity to your build and release process: you need a build environment for every one of those variants. And all those modules bloat your install bundle. Finally, no matter how many distro’s you prebuild for, it will never be enough: somebody will come along and insist that your code install on their favorite variant.
  3. Ship source that uses the LINUX_VERSION_CODE and KERNEL_VERSION macros. These macros, defined by the Linux kernel build system, allow you to conditionally include code based on the version of the kernel being built. In theory this is all you need, if you know which version introduced a particular feature. But there are two big problems. First, you probably don’t know exactly which version introduced each feature. You could figure it out with some detective work, but who’s got the time to do that? Second, and far more troublesome, most enterprise Linux distributions (RHEL, SUSE, etc.) backport features and fixes from later kernels to their base kernel — without changing the value of LINUX_VERSION_CODE. Of course that renders this mechanism useless.

genconfig.sh: a configure script for kernel modules

Conceptually, genconfig.sh works the same way as an autoconf configure script: it uses a series of trivial test programs to check for different kernel features or constructs. The success or failure of each test to compile determines whether the corresponding feature is present, and by extension whether or not a particular bit of code ought to be included in the driver.

For example, in some versions of the Linux kernel (2.6.9, eg), struct inode includes a member called i_blksize. If present, this field should be set to the blocksize of the filesystem that owns the inode. It’s used in the implementation of the stat(2) system call. It’s a minor detail, but if you’re implementing a filesystem driver, it’s important to get it right.

We can determine whether or not to include code for this field by trying to compile a trivial kernel module containing just this code:

#include <linux/fs.h>
void dummy(void)
{
    struct inode i;
    i.i_blksize = 0;
    return;
}

If this code compiles, then we know to include code for managing the i_blksize field. We can create a header file containing a #define corresponding to this knowledge:

#define HAVE_INODE_I_BLKSIZE

Finally, the driver code uses that definition:

#ifdef HAVE_INODE_I_BLKSIZE
  inode->i_blksize = FS_BLOCKSIZE;
#endif

We can construct an equally trivial test case for each feature that is relevant to our driver. In the end we get a header with a series of defines, something like this:

#define HAVE_INODE_I_BLKSIZE
#define HAVE_3_ARG_INT_POSIX_TEST_LOCK
#define HAVE_KMEM_CACHE_T
#define HAVE_MODE_IN_VFS_SYMLINK
#define HAVE_3_ARG_PERMISSION
#define HAVE_2_ARG_UMOUNT_BEGIN
#define HAVE_PUT_INODE
#define HAVE_CLEANUP_IN_KMEM_CACHE_CREATE
#define HAVE_WRITE_BEGIN
#define HAVE_ADDRESS_SPACE_OPS_EXT
#define HAVE_SENDFILE
#define HAVE_DENTRY_IN_FSYNC

By referencing these definitions in the driver source code, we can make it source-compatible with a wide range of Linux kernel versions. To add support for a new kernel, we just have to determine which changes affect our module, write tests to check for those features, and update only the affected parts of our driver source.

This is more nimble, and far more manageable, than shipping prebuilt binaries for an endless litany of kernel variants. And it’s much more robust than relying on LINUX_VERSION_CODE: rather than implicitly trusting that a feature is present or absent based on an unreliable version string, we know for certain whether that feature is present, because we explicitly tried to use it.

Belt and suspenders: ensuring the driver works correctly

Now we have a strategy for shipping a driver that will build and load on a broad array of Linux variants. But this approach has introduced a new problem: how can we be sure that this driver that was just auto-configured and compiled on-the-fly will actually work as expected?

The solution to this problem has two components. First, we identified about a dozen specific Linux variants that are critical to our customers. The driver is exhaustively tested on each of these “tier 1” variants in every continuous integration build — over 3,000 automated unit tests are run against the driver on each. Of course, 12 variants is only a tiny fraction of the thousands of permutations that are possible, but by definition these variants represent the most important permutations to get right. We will know immediately if something has broken the driver on one of these variants.

Next, we ship a stripped down version of that unit test suite, and execute that automatically when the driver is built. This suite has only about 25 tests, but those tests cover every major piece of functionality — a reasonable compromise between coverage and simplicity. With this install-time test suite, we’ll know if there’s a problem with the driver on a particular platform as soon as somebody tries to install it.

Demonstration code

For demonstration purposes I have placed a trivial filesystem driver on my github repo. This driver, base0fs, was generated using the FiST filesystem generator, patched to make use of the genconfig.sh concept.

HOWTO: hide address-book status icons in Thunderbird 3.x

I just updated to the latest version of Thunderbird, 3.1.7. There’s lots to like in this release compared to the archaic 2.0.0.24 I was using before. Unfortunately, it also includes one feature that I really dislike: the address-book status icon. This is where Thunderbird puts a star next to each email address in the message header:

Address-book status icons in Thunderbird 3.x on Linux

I have three complaints about this “improvement”:

  1. I don’t really care if the email is in my address book. Don’t force me to deal with information that I’m not interested in.
  2. The icons are very distracting — one by itself might be alright, but a cluster of them, in bright yellow, just outside the area of visual focus (the message body) continually pulls my eye away from what I’m trying to do.
  3. It looks like my 7 year old daughter ran amok with a sheet of foil star stickers. There’s a time and a place for that kind of thing, and my mail reader is not it.

After far more research and experimentation than I care to admit (including downloading and searching the Thunderbird source code!), I figured out how to disable the address-book status icon in Thunderbird 3.x. Here’s the result:

Hidden address-book status icons

How to hide address-book status icons in Thunderbird 3.x

To hide address-book status icons in Thunderbird, you need to add the following code to your userChrome.css:

.emailStar {
  width: 0em;
  visibility:hidden;
}

userChrome.css lives in a chrome subdirectory of your Thunderbird profile directory. If you don’t already have a userChrome.css, just create one with the above contents.

After updating userChrome.css you’ll have to restart Thunderbird to see the change. Enjoy your newly uncluttered Thunderbird UI!

Flowviz 2.0.0

Last week I wrote about Flowviz, a workflow visualization plugin for ElectricCommander 3.8 that I put together in the course of one weekend. I was really pleased with how it turned out for the amount of time invested, but I felt that a little more work could really help round out the offering. So, after another weekend of effort (with no football game to distract me!), I am proud now to present Flowviz 2.0.0.

What’s New

The main improvement in Flowviz 2.0.0 is that it provides a way for you to create new transitions when looking at a workflow definition. Flowviz will render a small “+” in the corner of each state; clicking on it will create a new transition starting from that state:

In addition to that major feature, Flowviz 2.0.0 incorporates these minor improvments:

  • Configuration page which allows you to explicitly specify the path to the dot executable.
  • New BSD-based license, so you are free to use and abuse flowviz any way you like.
  • Tested on Windows servers.

Sidebar: injecting the add transition links

It turned out to be somewhat tricky to add the “+” links for the add transition operation. Under the covers, Flowviz uses graphviz to layout and render the workflow in SVG. Unfortunately, graphviz doesn’t provide a way to slap arbitrary additional elements into the render — basically, if you want something to appear in the image, it has to be either a node or an edge.

My first attempt was to simply create an additional node for each “+”. That had two problems: first, graphviz doesn’t provide much control over the size of individual nodes, so I wound up with these big, mostly empty boxes for those nodes, even though they only needed to be big enough to contain the “+”. Second, graphviz doesn’t provide much control over the positioning of individual nodes. Although you can explicitly set the coordinates of a node to an absolute position, there doesn’t seem to be a way to set the coordinates relative to another node — obviously I want the “+” nodes to be close to the state they are associated with.

So, I went back to the drawing board. Eventually, I came up with a new strategy: rather than trying to coerce graphviz to add the links, I would let graphviz do its thing, and then inject the links into the resulting SVG on the fly. SVG is just XML after all, and although it’s a rich language, the way that graphviz uses it is quite stylized. It was easy to scan the SVG output looking for the string class=”node”, the marker for the start of a new node description, then extract the coordinates of the box that represents that node and finally insert a new text element relative to those coordinates. The result is the image you see above: a small, unobtrusive “+” in the corner of each state.

Caveats and limitations

There are still a few limitations to Flowviz 2.0.0:

  1. The workflow definition view does not provide a way to delete states or transitions.
  2. The active workflow view does not support manual transitions with parameters.
  3. Flowviz uses SVG to display the graph. Firefox and Chrome both support SVG natively, but IE requires a client-side plugin.

Flowviz: Workflow Visualization for ElectricCommander

One of the marquee features of the ElectricCommander 3.8 release is a powerful workflow automation engine. It’s pretty slick, but once you get past a handful of states and transitions, it’s hard to keep track of what’s going on. So over the weekend I decided to see if I could write a visualization tool for Commander workflows. The result is Flowviz 1.0, a Commander plugin for graphically displaying workflow definitions and active workflows.

Installing Flowviz

Flowviz is packaged as a standard ElectricCommander plugin, flowviz.jar. Installation is simple: just use the Plugin Manager to install flowviz.jar.

In addition to the Flowviz plugin, you will need to install Graphviz on your Commander server. Packages are available for Linux and Windows, so installation should be relatively painless.

Once you have the pieces installed, you’ll have to set up a Commander view that incorporates Flowviz. I used this view definition:

<view>
  <base>Default</base>
  <tab>
    <label>Flowviz</label>
    <url>pages/Flowviz-1.0/flowviz</url>
  </tab>
</view>

Viewing active workflows

To view an active workflow with Flowviz, first go the Flowviz tab. There you’ll be able to specify the workflow to view, by giving the name of the project and the name of the workflow. Make sure the “Workflow” option is selected, then click the “Show workflow” button:

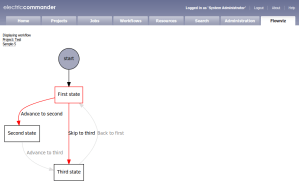
You’ll be rewarded with an image of your running workflow. The active state will be highlighted, as will any available manual transitions from that state:

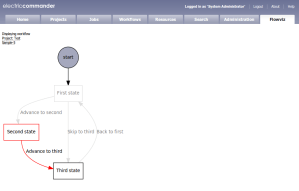
Clicking on an available transition will cause the workflow to follow that transition, and then you’ll be returned to the Flowviz visualization:

Viewing workflow definitions

To view a workflow definition with Flowviz, first go to the Flowviz tab. This time, enter the name of a project and the name of a workflow definition. Make sure the “Workflow definition” option is selected, then click the “Show workflow” button:

Flowviz will present a visualization of the specified workflow:

From here, you can add new states by clicking the “Create State Definition” link. Clicking on a node in the graph will take you to the “State Definition Details” page for that state.

Caveats and limitations

There are a few limitations to Flowviz 1.0:

  1. The active workflow view does not support manual transitions with parameters.
  2. The workflow definition view does not provide a way to directly add transitions; to do so, you must first bring up the “State Definition Details” for a state, and then add transitions via that interface.
  3. Flowviz uses SVG to display the graph. Firefox and Chrome both support SVG natively, but IE requires a client-side plugin.
  4. The server-side components of Flowviz have only been tested on Linux. Although I believe they should work (with minor modifications) on Windows, your mileage may vary.

UPDATE (Jan 25): thanks to some feedback from Electric Cloud engineering, I have restructured the plugin to avoid the need for the additional external CGI; the text above has been updated to reflect the new installation instructions.