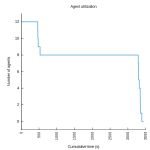
A few weeks ago I showed how to determine the number of agents used during an ElectricAccelerator build, using some simple analysis of the annotation file it generates. But, I made the unfortunate choice of a pie chart to display the results, and a couple of readers called me to task for that decision. Pie charts, of course, are notoriously hard to use effectively. So, it was back to the drawing board. After some more experimentation, this is what I came up with:
Some readers have said that this graph is confusing. Blast! OK, here’s how I read it:
The y-axis is number of agents in use. The x-axis is cumulative build time, so a point at x-coordinate 3000 means that for a total of 3000 seconds the build used that many agents or more. Therefore in the graph above, I can see that this build used 48 agents for about 2200 seconds; it used 47 or more agents for about 2207 seconds; etc.
Similarly, you can determine how long the build ran with N agents by finding the line at y-coordinate N and comparing the x-coordinates of the start and end of that line. For example, in the graph above the line for 1 agent starts at about 3100 seconds and ends at about 4100 seconds, so the build used just one agent for a total of about 1000 seconds.
Here’s what I like about this version:
- At a glance we can see that this build used 48 agents most of the time, but that it used only one agent for a good chunk of time too.
- We can get a sense of the health of the build, or it’s parallel-friendliness, by the shape of the curve— a perfect build will have a steep drop-off far to the right; anything less than that indicates an opportunity for improvement.
- We can see all data points, even those of little significance (for example, this build used exactly 35 agents for several seconds). The pie chart stripped out such data points to avoid cluttering the display.
- We can plot multiple builds on a single graph.
- It’s easier to implement than the pie chart.
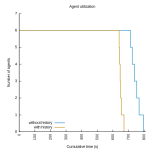
Here are some more examples:
A glitch in the matrix
While I was generating these graphs, I ran into an interesting problem: in some cases, the algorithm reported that more agents were in use than there were agents on the cluster! Besides being impossible, this skewed my graphs by needlessly inflating the range of the y-axis. Upon further investigation, I found instances of back-to-back jobs on a single agent with start and end times that overlapped, like this:
<job id="J00000001">
  <timing invoked="1.0000" completed="2.0002" node="linbuild1-1"/>
</job>
<job id="J00000002">
  <timing invoked="2.0000" completed="3.0000" node="linbuild1-1"/>
</job>
Based on this data, it appears that there were two jobs running simultaneously on a single agent. This is obviously incorrect, but the naive algorithm I used last time cannot handle this inconsistency — it will erroneously consider this build to have had two agents in use for the brief interval between 2.0000 seconds and 2.0002 seconds, when in reality there was only one agent in use.
There is a logical explanation for how this can happen — and no, it’s not a bug — but it’s beyond the scope of this article. For now, suffice to say that it is to do with making high-resolution measurements of time on a multi-core system. The more pressing question at the moment is, how do we deal with this inconsistency?
Refining the algorithm
To compensate for overlapping timestamps, I added a preprocessing phase that looks for places where the start time of a job on a given agent is earlier than the end time of the previous job to run on that agent. Any time the algorithm detects this situation, it combines the two jobs into a single “pseudo-job” with the start time of the first job, and the end time of the last job:
    $anno indexagents
    foreach agent [$anno agents] {
        set pseudo(start)  -1
        set pseudo(finish) -1
        foreach job [$anno agent jobs $agent] {
            set start  [$anno job start  $job]
            set finish [$anno job finish $job]
            if { $pseudo(start) == -1 } {
                set pseudo(start)  $start
                set pseudo(finish) $finish
            } else {
                if { int($start * 100) <= int($pseudo(finish) * 100) } {
                    set pseudo(finish) $finish
                } else {
                    lappend events \
                        [list $pseudo(start)  $JOB_START_EVENT] \
                        [list $pseudo(finish) $JOB_END_EVENT]
                    set pseudo(start)  $start
                    set pseudo(finish) $finish
                }
            }
        }
    }
With the data thus triaged, we can continue with the original algorithm: sort the list of start and end events by time, then scan the list, incrementing the count of agents in use for each start event, and decrementing it for each end event.
Availability
You can find the updated code here at GitHub. One comment on packaging: I wrote this version of the code as an ElectricInsight report, rather than as a stand-alone script. The installation instructions are simple:
- Download AgentUtilization.tcl
- Copy the file to one of the following locations:
- <install dir>/ElectricInsight/reports
- (Unix only) $HOME/.ecloud/ElectricInsight/reports
- (Windows only) %USERPROFILE%/Electric Cloud/ElectricInsight/reports
- Restart ElectricInsight.
Give it a try!


