Last fall the ElectricAccelerator development team switched to Atlassian HipChat for instant messaging, in place of the venerable Yahoo! Messenger. I’ve written previously about the benefits of instant messaging for development teams, particularly for geographically distributed teams like ours. The main reason for the switch was HipChat’s persistent group chat, which allows us to set up multi-user conversations for product teams. We’ve been using HipChat for several months now, and I thought it might be interesting to do some analysis of the Accelerator team chat room. To that end I wrote hipstat, a Python script which uses matplotlib to generate a variety of visualizations from the data in HipChat’s JSON logs. You can fork hipstat on GitHub — please excuse the non-idiomatic Python usage, as I’m a Python newb.
Team engagement
The first thing I wanted to determine was the level of team engagement: how many people actually use the group chat. You see, for the first few months of our HipChat deployment, the Accelerator chat room was barely used. But it’s a nasty chicken-and-egg problem: if nobody is using the chat room, then nobody will use the chat room. I confess I didn’t use it myself, because it seemed frivolous.
It seemed a shame to let such a resource go unused — I thought that the chat room could be a good way to socialize ideas and share knowledge, maybe not with the same depth of a one-on-one conversation, but surely something would be better than nothing. To get past the chicken-and-egg problem I made a deliberate effort to use the chat room more often myself, in hopes that this would spur other team members to do the same. To guage the level of engagement I graphed the number of active users per day, as well as a simple fit-to-curve calculation to better summarize the data:
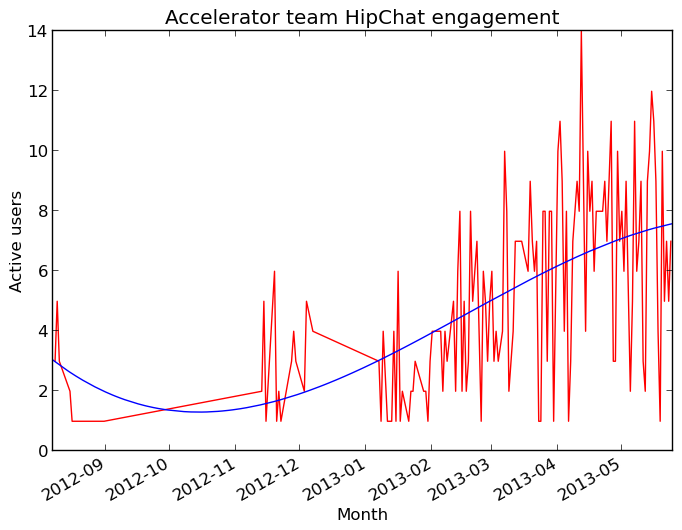
As expected, engagement was low initially but has gradually increased over time. It appears to be plateauing now at about 7-8 users, which is roughly the size of the development team.
Look who’s talking!
Of course my definition of “active user” is pretty lax — a person need only make one comment a day to be considered active. I thought it would be interesting to see which users are speaking most often in the group chat. This graph shows the percentage of total messages from by each user each month since we started using HipChat:

This graph suggests that I tend to dominate the conversation, at least since I started making an effort to use the chat room — ouch! That’s probably because of my leadership role within the team. Fortunately the most recent data shows other people are speaking up more often, which should lead to a more balanced conversation on the whole.
When are we talking?
Next I wanted to see when the chat room is most active, so I generated a heatmap showing the number of messages sent over the course of each day of the week. Darker blocks indicate a larger number of messages during during that time period:

Not surprisingly, most of the activity is clumped around standard business hours. But there are a couple of peculiar outliers, like the spike in activity just after midnight on Thursday mornings. Turns out that’s primarily conversation between myself and our UK-based teammate. I haven’t figured out yet why that only seems to happen on Thursdays though — except that I often stay up late watching TV on Wednesday nights!
Whatcha talkin’ ’bout, Willis?
Finally, I wondered if there was any insight to be gained by studying the topics we discuss in the chat room. One easy way to do that is a simple word frequency analysis of the words used, and of course the best way to visualize that is with a tag cloud. Hipstat can spit out a list of the most commonly used words in a format suitable for use with Wordle. Here’s the result:
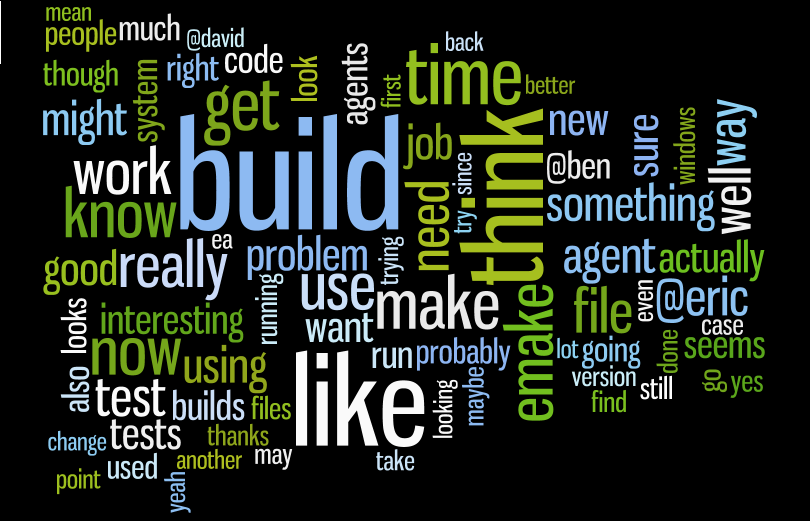
I find this oddly comforting — it’s reassuring to me that the words most often used in our conversations are things like build, time, emake and of course think. I mean, this could have shown that we spend all our time griping about support tickets and infrastructure problems, or even idly chit-chatting about the latest movies. Instead it shows our focus on the problems we’ve set out to solve and, I think, an affirmation of our values.
Hipstat for your HipChat group chat
After several months I think that we are now getting good value out of our HipChat group chat room. It took us a while to warm up to it, but now the chat room serves as a good way to share broad technical information, as well as giving us a “virtual water cooler” for informal conversation.
If you’d like to take a look at your own HipChat group chat logs, you can get hipstat on GitHub. Then you can use the HipChat API to download chat room logs in JSON format. From my trials it seems that the API only allows access to most recent two weeks of logs, so if you want to do analysis over a longer period of time you’ll have to periodically save the logs locally. Then you can generate all of the graphs shown here (except the tag cloud, which requires help from Wordle) using hipstat. For example, to generate the heatmap, you can use hipstat.py –report=heatmap < messages.json to display the result in a window, or add –output=heatmap.png to save the result to a file.
